
• Skip to main content

    Analysis

    Construction and Manufacturing Employment

    Written by Peter Wright


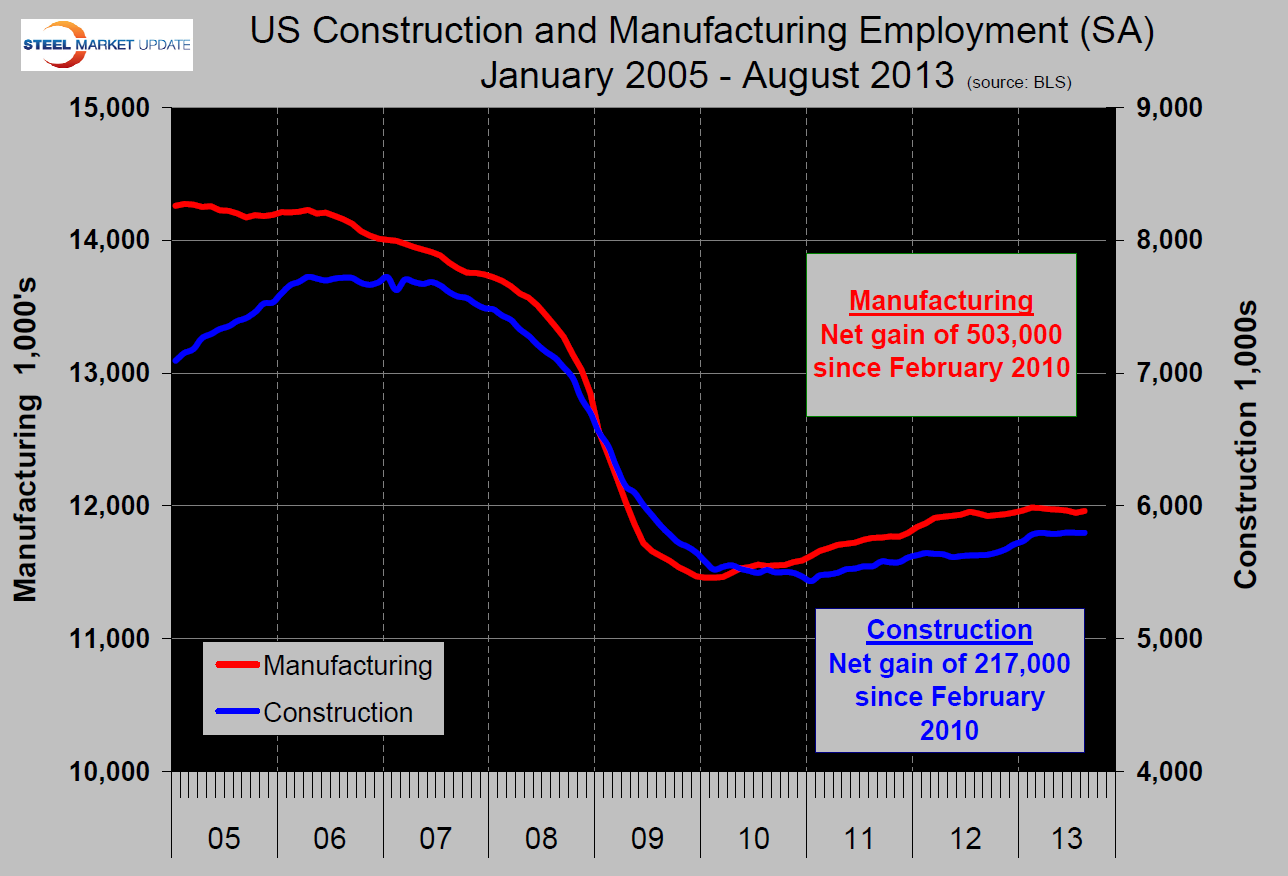
    The partial federal government shutdown prevented the Bureau of Labor Statistics from publishing the September data which was scheduled for last Friday. We have therefore decided to take a more in depth look at manufacturing and construction employment through August. The graph below shows the change in total employment for these two sectors since January 2005. In 2010 and 2011, manufacturing employment took off faster than the construction sector; in H2 2012 construction closed the gap. In 2013 through August construction added 87,000 jobs, all of which occurred in Q1, year to date manufacturing has only added 12,000 jobs. The bright spot in manufacturing this year has been motor vehicles and parts which have added 30,000 jobs. In the same time frame employment in the primary metals sector has declined by 5,000.

    Latest in Analysis

    Price: Blue wave may rock tariff boat, but some ships like Section 232 aren’t sinking

    The midterms are over, and Democrats will control both chambers of Congress in January. In this space last week, Lewis Leibowitz predicted that President Trump's tariffs, including Section 232, may not last much longer. We disagree. To be sure, the new Congress will change trade policy. It will hold hearings, write bills, and almost certainly revisit the trade dispute with Canada. But the foundation of US trade policy is unlikely to be disturbed. Section 232 and Section 301 are established, court-tested authorities that both parties have used. They are also working.

    SMU Survey: Current and Future Steel Buyers’ Sentiment Indices rise

    SMU’s Current and Future Steel Buyers’ Sentiment Indices increased this week, according to our latest market survey.   Every two weeks, SMU polls thousands of steel-industry executives, asking them to rate their companies’ chances of success today and also three to six months down the road. We use their responses to calculate our proprietary Current and Future Steel Buyers’ Sentiment Indices, measures tracked since 2008.

    US heating and cooling shipments fall for third straight month

    US shipments of heating and cooling equipment slipped in September for a third consecutive month, according to the latest data from the Air-Conditioning, Heating, and Refrigeration Institute (AHRI). Shipments declined 2.6% month on month (m/m) in September, after having fallen 10% m/m in August. The monthly pace marks the third-slowest shipment rate year to date. Historically, shipments are strongest in early summer and weakest around the turn of the year, driven by seasonal air conditioner and heat pump volumes. AHRI's data shows September shipments totaled 1,687,240 units, down 2.6% m/m but up 7.7% year over year (y/y) (Figure 1, left). From August to September, shipments of warm air furnaces, A/C, and heat pumps declined, while water heater shipments rose. Compared with a year earlier, only air conditioners and heat pump shipments were higher.