

Prices
November 1, 2013
U.S. Rig Count Down 58 and Canada Up 11 Rigs from Previous Year
Written by Brett Linton
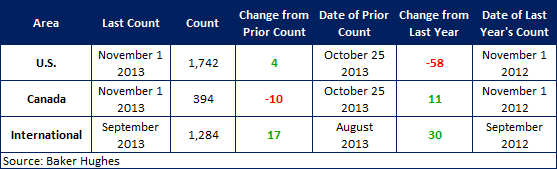
According to Baker Hughes data from November 1st, 2013, the U.S rig count for this week is 1,742 rigs exploring for or developing oil or natural gas. This count is an increase of 4 rigs when compared to last week, with oil rigs up 19 to 1,376 rigs, gas rigs down 16 to 360 rigs, and miscellaneous rigs up 1 to 6 rigs. Compared to last year the 1,742 count is a decrease of 58 rigs, with oil rigs up by 3, gas rigs down by 64, and miscellaneous rigs up by 3.
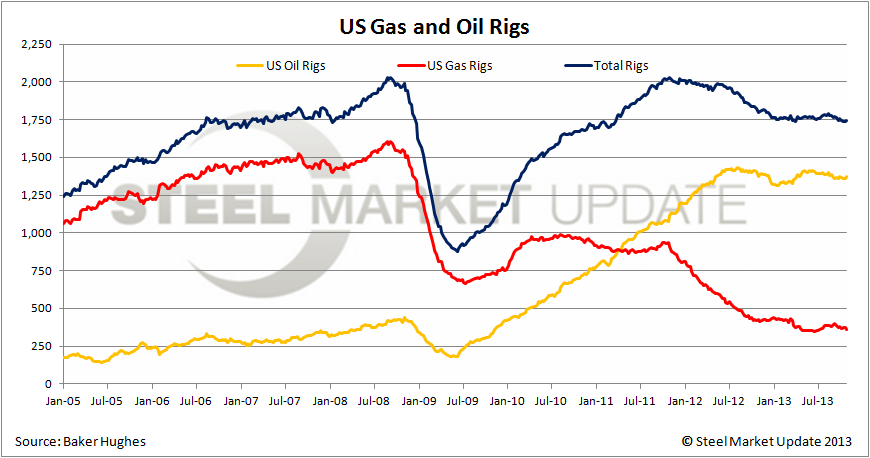 The Canadian rig count decreased by 10 to 394 rigs this week, with oil rigs down 16 to 233 rigs, and gas rigs up 6 to 161 rigs. Compared to last year the 394 count is an increase of 11 rigs, with oil rigs down by 58 and gas rigs up by 69. International rigs increased by 17 to 1,284 rigs for the month of September, an increase of 30 rigs from the same month one year ago.
About the Rotary Rig Count
A rotary rig is one that rotates the drill pipe from the surface to either drill a new well or sidetracking an existing one. They are drilled to explore for, develop and produce oil or natural gas. The Baker Hughes Rotary Rig count includes only those rigs that are significant consumers of oilfield services and supplies.
The Baker Hughes North American Rotary Rig Count is a weekly census of the number of drilling rigs actively exploring for or developing oil or natural gas in the United States and Canada. Rigs considered active must be on location and drilling. They are considered active from the time they break ground until the time they reach their target depth.
The Baker Hughes International Rotary Rig Count is a monthly census of active drilling rigs exploring for or developing oil or natural gas outside of the United States and Canada. International rigs considered active must be drilling at least 15 days during the month. The Baker Hughes International Rotary Rig Count does not include rigs drilling in Russia or onshore China.


