

Market Data
November 4, 2013
SMU Manufacturing Indicators
Written by Peter Wright
Review of Manufacturing. October 31st 2013
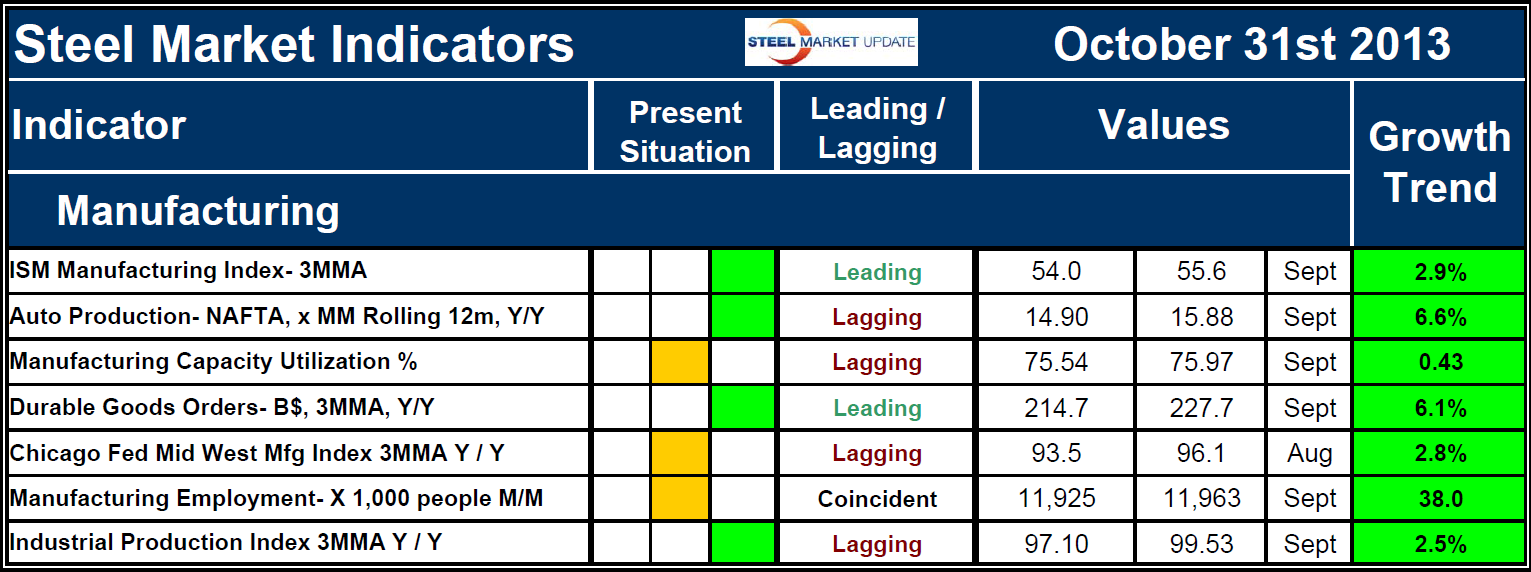
Each month the Steel Market Update publishes a table of what we believe to be the most significant indicators of the state of the steel market and current results in the long and flat rolled sectors. We will be discussing one section of this table in detail each month, beginning with manufacturing, Table 1. An explanation of the structure of this chart is given at the end of this piece for the benefit of those readers who are not familiar with it.
We consider seven indicators of manufacturing activity. Two of these we believe to be leading, one coincident and four lagging. This subdivision is subjective but we believe it to be defensible. The current values of the two leading indicators, which are the Institute of Supply Management manufacturing index, (PMI), and durable goods orders are both characterized as positive meaning that their current value is above the historical norm.
Auto production and the Federal Reserve industrial production index are both lagging indicators and are also positive.
Manufacturing capacity utilization is characterized as neutral but its value of 75.97 percent is barely above the recessionary threshold of 75.0 percent. There is plenty of capacity to absorb the current growth of manufacturing activity. A normal utilization is believed to span the range of 75 to 85 percent.
The Chicago Fed Midwest manufacturing index, (CFMMI) and manufacturing employment are also characterized as neutral in today’s world. The CFMMI is a monthly estimate by major industry of manufacturing output in the Seventh Federal Reserve District states of Illinois, Indiana, Iowa, Michigan and Wisconsin. It is a composite index of 15 manufacturing industries that uses hours worked data to measure monthly changes in regional activity. Manufacturing employment data is provided by the Bureau of Labor Statistics monthly and breaks total employment down into sub groups such as manufacturing and a plethora of line items within each sub group.
Manufacturing has added over five million jobs since the recession but the employment level is still lower than at any time in pre-recessionary history. This sounds depressing and is widely reported as evidence for the expiration of manufacturing in the US. However the other side of the coin is that manufacturing productivity has had a compound annual growth rate of 3.6 percent since 1990 and unit labor costs in the US are almost exactly the same as they were in 1990 measured in constant dollars. In January 1990 the number of people employed in manufacturing was 17,799,000. By September 2013 manufacturing employment was 11,963,000 a decline of 33 percent but this change was entirely (and more) a result of the increase in productivity.
The right hand side of Table 1 details the current value of the seven manufacturing indicators and the direction in which those indicators are moving. Based on data received in October, all seven manufacturing indicators are moving in the right direction. The strongest indicators are automotive production and durable goods orders, both of which have year over year growth rates of > six percent. The ISM index, the CFMMI and the Industrial production index are mutually supportive in the range 2.5 to 2.9 percent growth.
Manufacturing capacity utilization is improving slowly. In the 12 months to September manufacturing added 38,000 jobs, 2,000 of which were created in September. It has been widely reported that the boom in shale gas and oil production will provide a competitive advantage to US manufacturing and that the trend to off shoring will shortly reverse. We at SMU are therefore optimistic regarding manufacturing over the next decade and it’s consequent positive effect on steel consumption.
By reviewing multiple indicators in this way we believe we are obtaining a true and comprehensive picture and avoiding the knee jerk reactions that the press routinely exhibits.
On October 29th the National Association of manufacturers published the following piece on government regulation of manufacturing;
Washington D.C. 10/29/2013. The National Association of Manufacturers (NAM) announced today that former Sens. Blanche Lincoln (D-AR) and George Allen (R-VA) will co-chair the Manufacturing Competitiveness Initiative, an effort aimed at examining and highlighting the competitiveness challenges facing manufacturers.
“We must continually strive to keep the United States as the best place in the world to manufacture, innovate and attract investment, but all too often, government policies on regulation, litigation, energy and taxes stand in our way,” said Caterpillar Chairman and CEO and NAM Board Chair Doug Oberhelman. “Senators Allen and Lincoln have a long history of reaching across the aisle to find pro-growth, pro-business solutions, and I look forward to their efforts to help strengthen manufacturing.”
Among the first challenges the bipartisan partnership will take on are the impact of unnecessarily burdensome regulations on manufacturers. “Our regulatory system is too often incoherent, unaccountable and in desperate need of reform,” said Allen. “As governor, I witnessed firsthand the impact that regulations can have on a growing economy and small businesses in particular. In Virginia, we took a collaborative approach to protecting public health, ensuring the safety of working men and women and safeguarding the environment without hindering growth. We enacted commonsense policies that eliminated duplicative and complex regulations and embraced smart, innovative ways to achieve shared goals.”
“As senator, I heard from manufacturers and small business owners about the impact of inconsistent and uncertain regulatory policy,” said Lincoln. “We can do better as a nation. To unleash the creative spirit of America’s entrepreneurs, we need a commonsense regulatory system that encourages innovation and investment. An American economy with a simple and streamlined regulatory system would be the envy of the world. I look forward to examining ways in which both parties can work together to address this important issue.”
Lincoln and Allen will work with the NAM and its members to advance a manufacturing agenda that is focused on real priorities and reforms unnecessary impediments to growth.
Explanation of Key Indicators: The key indicators chart is designed to give a snapshot of the steel market on a specific date. The chart is stacked vertically to separate the primary indicators of the general economy, of proprietary Steel Market Update indices, of both flat rolled and long product market indicators and finally of construction and manufacturing indicators. The indicators are classified as leading, coincident or lagging as indicated.
Columns in the chart are designed to differentiate between the current situation and the direction in which the market is headed. The present situation is sub-divided into, below the historical norm (-), (OK), and above the historical norm (+). The “Values” section of the chart is a quantitative definition of the market’s direction. In cases where seasonality is an issue, the evaluation of market direction is made on a three month moving average basis and compared year over year to eliminate this effect. Where seasonality is not an issue concurrent periods are compared. The date of the latest data is identified in the third values column. Values will always be current as of the date of publication. Finally the far right column quantifies the trend as a percentage or numerical change with color code classification to indicate positive or negative direction.


