Analysis

November 5, 2013
CPIP for August: Focus on Infrastructure
Written by Peter Wright
The Department of Commerce economic data is running late and in the case of CPIP the September data will be released along with October on December 2nd. We now have August data released almost a month late. Normally, this would be a Premium Level analysis only. Since the reports are running behind we decided to share the data with our Executive members as well as Premium.
The Commerce Department compile their information based on the source of financing. These categories are, private, state + local and federal. There are a huge number of sub categories in the private and state + local construction expenditure categories, not so many in federal where expenditures are minimal. At Steel Market Update we combine these sub categories in-order to make the data comprehendible and produce a comprehensive report each month. For the purpose of this write-up we will concentrate on infrastructure expenditures.
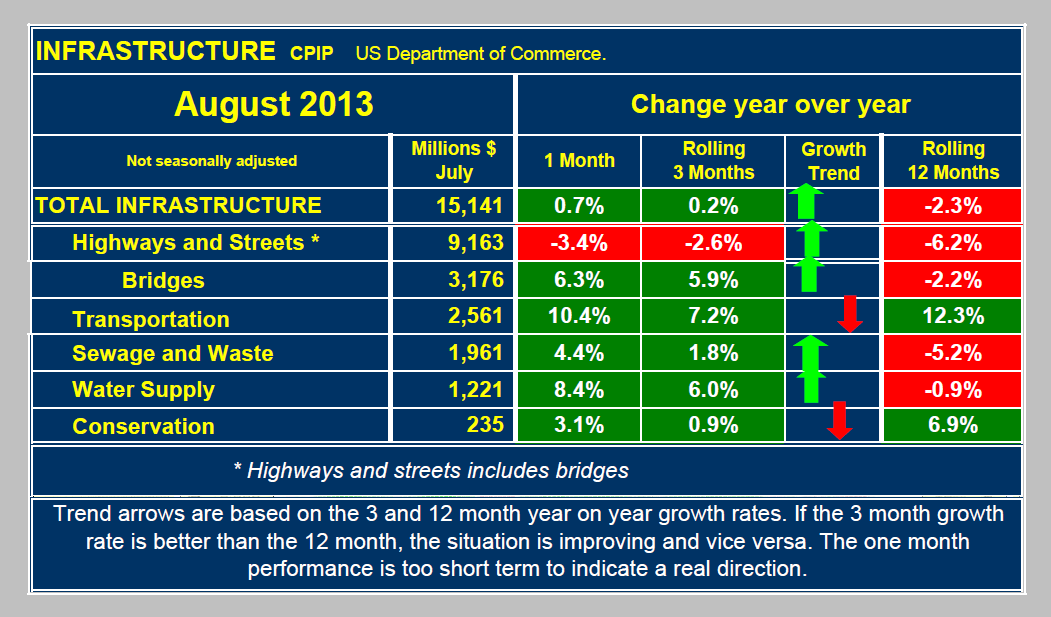
In August, total construction expenditures were $87.01 billion of which 67.9 percent was privately funded, 29.8 percent was state and local and 2.4 percent was federally financed. Of the total expenditures, 80.3 percent, (August only) falls into three major categories, 44.3 percent of total construction expenditures were non residential buildings, single family residential was 18.6 percent and infrastructure 17.4 percent (Table 1).
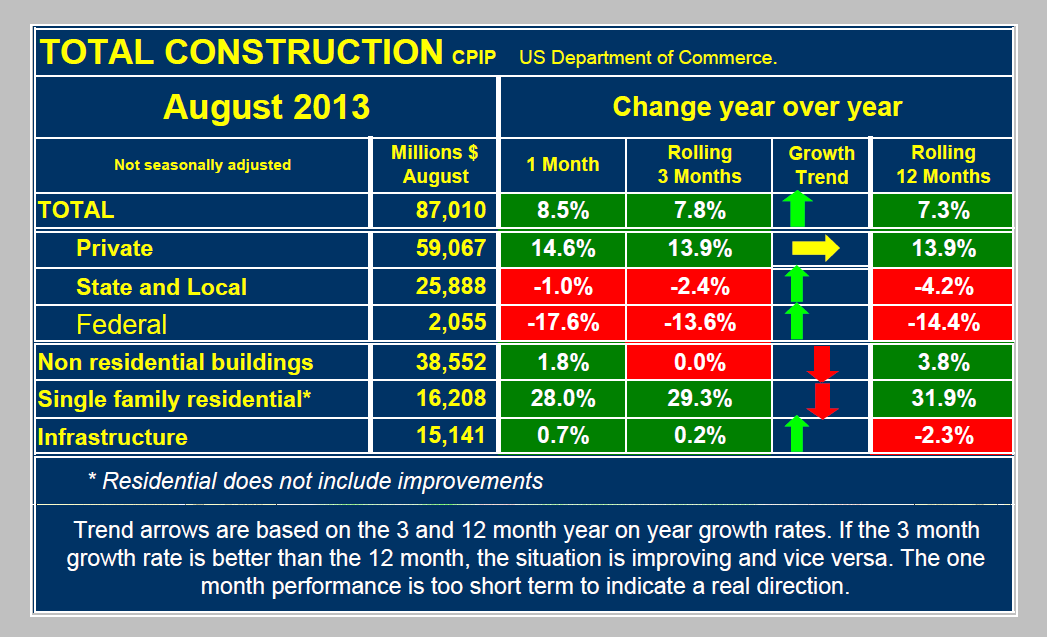
 Total construction in August was up by 8.5 percent compared to August last year, (y / y), on a rolling three month basis construction grew 7.8 percent y / y and on a rolling 12 month basis growth was 7.3 percent y / y. There is no point comparing construction statistics one month or one quarter after another as the results are so seasonal that such a comparison is meaningless. The fact that the growth rates are increasing as the comparison time period year over year is decreased means that the growth of total construction is accelerating. This is also true of infrastructure expenditures as can be seen in Table 1, but in this case expenditures are barely turning the corner.
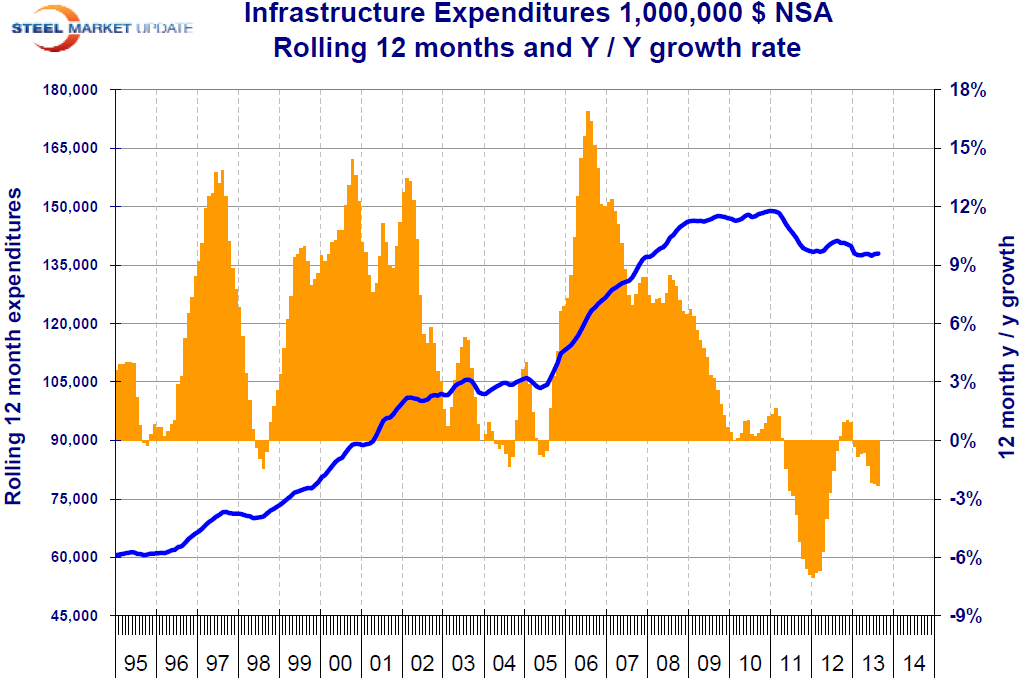
Figure 1 shows that total infrastructure expenditures on a rolling 12 months basis have been declining for eight straight months year over year. Table 2 shows the breakdown on infrastructure expenditures into its major components. The largest sector is highways and streets which are still declining, albeit more slowly as shown by the comparison between the three and twelve month rolling averages. Bridges, a sub sector of highways and streets have had positive growth in three months through August.