

Market Data

November 10, 2013
Growth of Disposable Income Per Person Hit Zero in 3Q
Written by Peter Wright
If we start with the premise that the consumer is almost 70 percent of GDP (gross domestic product) and that steel consumption is closely correlated with GDP, then consumer behavior and in particular debt is very relevant to our future businesses.
 Consumer spending is driven by income and both the perception of current debt and willingness to take on more. The Federal Reserve reports of personal income and credit outstanding are important pieces of the jigsaw puzzle of steel demand, past present and future.
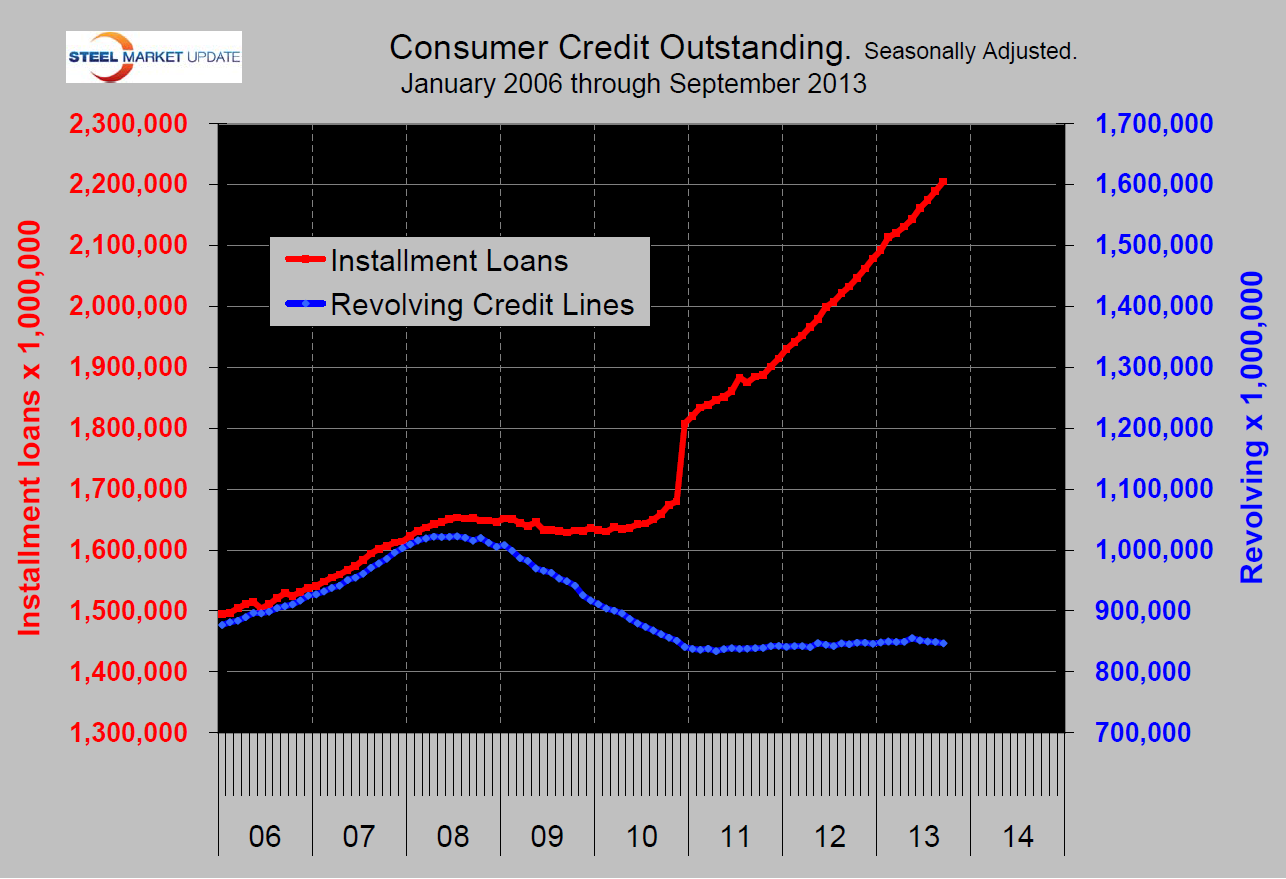
The change in the mix of consumer debt between installment and revolving (credit cards) since the recession has been remarkable. Through Q3 2013 installment loans which are about half related to big ticket items and half to student loans continue to soar as revolving debt stagnates (Figure 1). It has been estimated that in the mid 2000s about 2 percent of GDP was created by consumer borrowing using both credit cards and their home equity as a piggy bank.
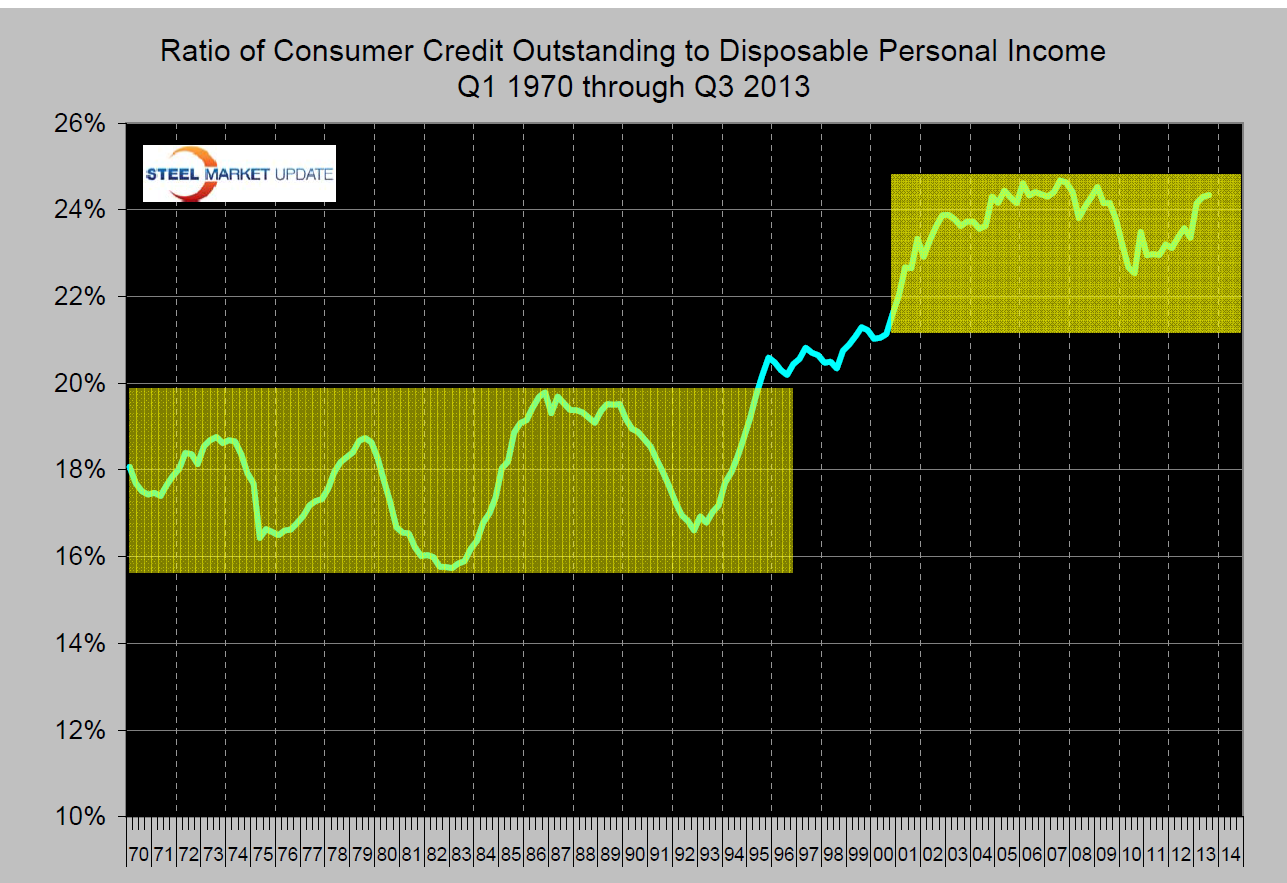 The ratio of consumer debt to personal disposable income rose from its long term range of 16 to 20 percent to over 24 percent (Figure 2). This ratio declined after the recession but is now surging again and in Q3 was once again over 24 percent. It is evident that the consumer has resumed his/her attempt to maintain and improve their standard of living by going deeper into the hole. Wealth effects from rising house prices and stock portfolios are helping push installment balances to new highs. Consumers are able to take advantage of extremely low interest rates and easier access to credit to finance spending on big-ticket items which is good for steel in the short term but of questionable sustainability.
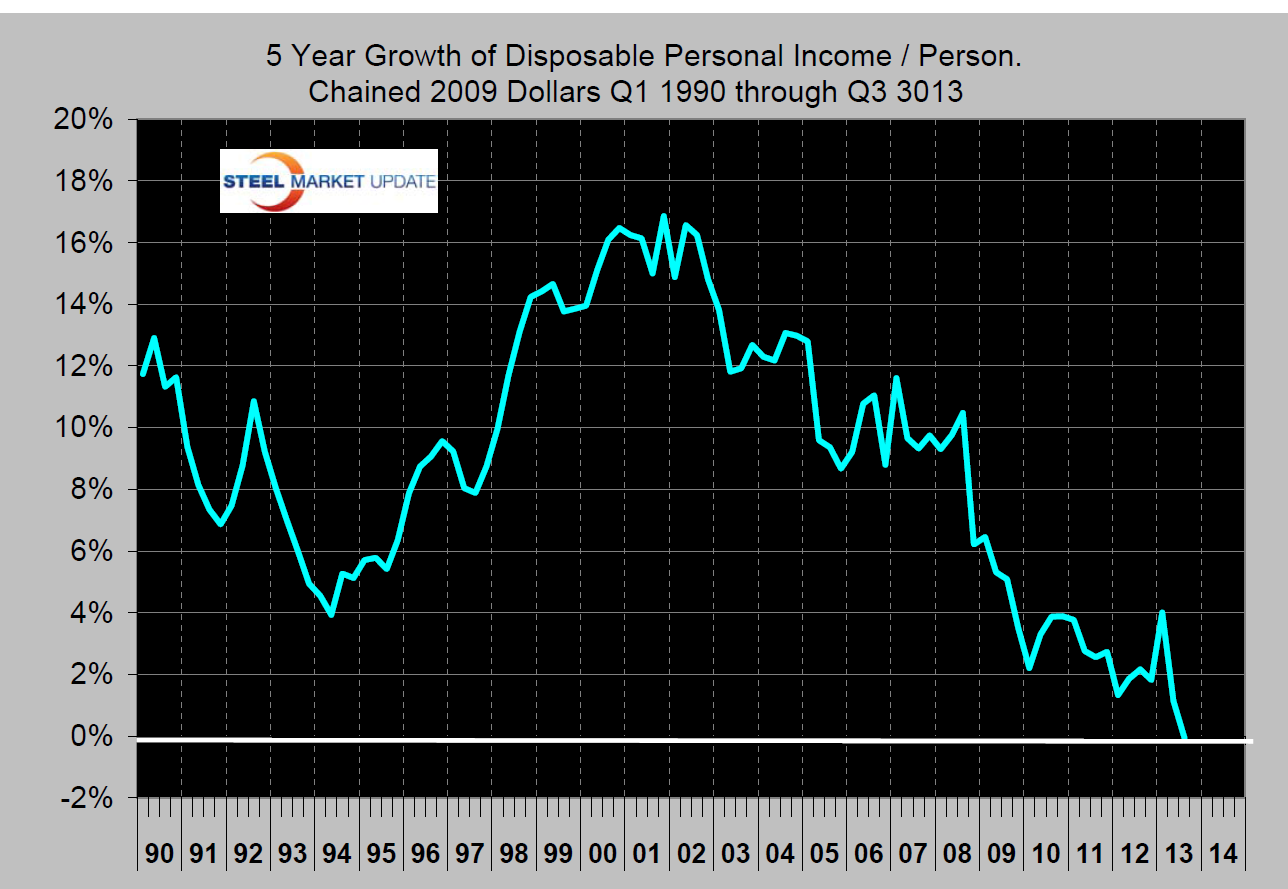 The really bad news is that the five year growth of disposable income per person hit zero in Q3, meaning that on a constant dollar basis income was exactly the same as it was five years ago (Figure 3).
It is not our purpose at SMU to make political statements but it strikes us that given the disparity between incomes in the US and Europe and the rest of the world that this situation is inevitable and not readily reversible. We need a national recognition of the global situation and a plan to alleviate the economic symptoms that bombard us. Much of the economic data that we report in this Executive Newsletter is of a relatively short term nature, meaning a five year horizon. The issue of declining income/capita and high unemployment by historical standards will be with us for decades.


