

Analysis
December 5, 2013
Construction Update for December
Written by Peter Wright
Each month Steel market Update publishes a table of 38 indicators that we believe captures the essence of the steel market and its drivers. Six of these indicators deal with construction which we believe consumes about 22 percent of all steel products in the US at present. Table 1 shows the construction section of the steel consumption indicators analysis as of December 2nd. The indicators are classified as leading, coincident or lagging as indicated.
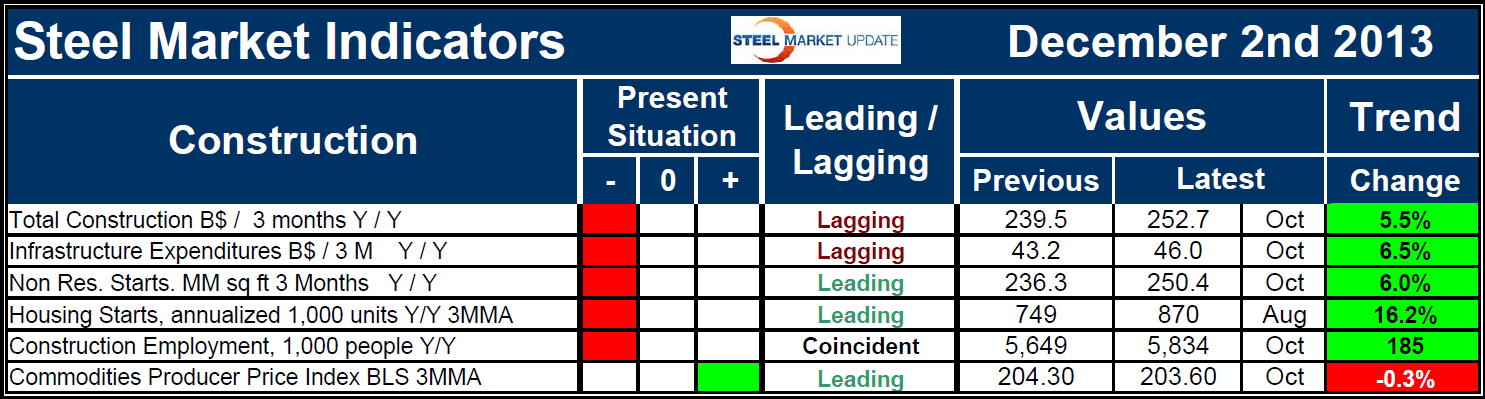
Columns in the chart are designed to differentiate between the present situation and the direction in which the market is headed. The present situation is sub-divided into: below the historical norm (-), (OK), and above the historical norm (+). The “Values” section of the chart is a quantitative measure of the market’s direction using the latest published data. In cases where seasonality is an issue, the evaluation of market direction is made on a three month moving average basis and compared year-over-year to eliminate this effect. Where seasonality is not an issue concurrent periods are compared. The date of the latest data is identified in the third values column. Finally the far right column quantifies the trend as a percentage or numerical change with color code classification to indicate positive or negative direction.
The present situation of the construction industry based on historical comparison is negative in all components except the producer price index of commodities which we believe to be a driver of industrial construction.
The latest trend of expenditures is the exact opposite with all indicators trending positive except the PPI of commodities. The first two line items, total and infrastructure construction expenditures, are extracted from the monthly Commerce Department CPIP data base. On a rolling 12 month basis, total construction peaked in October 2006 at $1.15 trillion. The October 2013 value was $887 billion, a decline of 23.2 percent. Total construction has had positive growth for 25 straight months on a year-over-year basis but at the present rate it will be mid-2018 before the pre-recessionary peak is regained.
Infrastructure work peaked in January 2011, well after the recession because, once started, most of these projects have a long gestation period. Peak infrastructure expenditures on a 12 month rolling basis were $148.8 billion and by October 2013 had declined by 5.4 percent to $140.8 billion. Infrastructure expenditures have declined for 22 of the last 30 months on a rolling 12 month basis. Just as infrastructure work was slow to respond to the recession, so will it be slow to recover and that will take recognition by congress that such work is an investment in our economic future. We consider CPIP data to be a lagging indicator because it reports what has already happened.
The next two line items in Table 1 are non residential starts and housing starts. We regard both these to be leading indicators because they suggest future steel consumption. Historically housing starts have led non residential by about 18 months but this time is different. Housing has improved much faster than non residential. The August total annualized was 891,000 with a 3MMA of 870,000 and a growth rate of 16.1 percent. Single family starts 3MMA were 607,000 annualized with a growth rate of 15.3 percent. Structures with > 5 units totaled 250,000, up 16.8 percent year over year. Even though the growth of housing has been quite spectacular on a percentage basis since mid 2011, it must be realized that this was because the recessionary trough was so severe.
Due to the government shutdown, the latest housing start data is for August. September through November starts will not be released until December 18th. Through August, starts data single family housing is 61.9 percent below the peak of October 2005. At the present rate it will be well into the next decade before the pre-recessionary peak is achieved and that “optimistic” estimate assumes that the recent slowdown resulting from rising mortgage interest rates is just a blip.
Multi-family units, (apartments) suffered less from the recession and by the beginning of this year had fully recovered. By August the growth of total housing starts had slowed at the national level on a year over year basis. On a regional basis the South grew fastest during the recovery and has been entirely responsible for the recent decline in starts. The West, Mid West and North east have been essentially flat this year.
Existing-home prices as measured by the S&P/Case-Shiller® indexes accelerated on a year-ago basis in the three months ending in August relative to the same period in July. The 10-city composite is up 12.8 percent from last year, compared with the 12.3 percent gain originally reported last month. All 20 cities in the index posted monthly price gains in August.
Delinquencies and foreclosures are much improved according to the Mortgage Bankers Association. The aggregate mortgage delinquency rate plunged 55 basis points to 6.41 percent in the third quarter, the lowest since the second quarter of 2008. The percent of loans in foreclosure declined by 25 basis points from last quarter, while foreclosure starts shaved 3 basis points to the lowest level since the second quarter of 2007. Overall housing loan credit quality continues to show improvement, but persistently tight credit and weak income growth are limiting a quick turnaround in the housing market.
Non residential construction starts are reported by the Dodge division of McGraw Hill. As noted above, the recovery has been weaker than for residential and at the present rate it will be the late 2020s before the pre-recessionary peak is achieved and that peak was well below the heady days of 2000. It is quite possible that the internet revolution and the trend for more people to work from home will result in previous non residential peaks never being achieved.
Non residential starts have shown positive growth for 25 straight months on a rolling 12 month basis and in October were up by 6.3 percent year over year. Growth on this basis has slowed continuously since February 2013 when the growth rate was 13.9 percent. Since the most recent peak of August 2007 total non residential starts in October were down by 52 percent ranging from 27.3 percent for parking garages to 81.4 percent for religious buildings.
Based on Commerce Department CPIP data through October, and comparing a rolling 12 months year-over-year, private non residential construction grew by 3.6 percent and state and locally funded work contracted by 3.6 percent. States, in particular, continue to have budgetary problems on both sides of their balance sheets. Income receipts from various forms of taxation have not recovered and obligations, particularly for Medicare, are increasing. Discretionary spending for municipal buildings will take a back seat for the foreseeable future. State and locally funded educational buildings on a rolling 12 month basis have declined from $87 billion in mid-2009 to $60.9 billion through October 2013.
Construction employment grew by 3.3 percent in the 12 months through October. All the major categories that we track at SMU had positive growth except highways and streets which lost 1.1 percent. Total employees of construction industries as reported by the Bureau of Labor Statistics, (BLS) in October were 5,834,000 an increase of 312,000 since the low point of March 2010. We regard this line item in Table 1 as a concurrent indicator since it is what it is and doesn’t change very rapidly.
Construction employment increased in 39 states over the past 12 months, the most widespread gains since April 2012, according to an analysis of BLS data by the Associated General Contractors of America. Association officials said action on needed infrastructure investments for water and transportation projects would help support continued employment growth for the industry. Welcome as the employment gains are, association officials cautioned that industry’s recovery was still uneven and urged Congress and the administration to enact measures to help repair and upgrade aging water and transportation systems. In particular, they urged a Congressional conference committee to settle differences between House and Senate versions of the Water Resources Development Act and pass a final bill. They also urged Congressional negotiators to include infrastructure funding as part of any final budget deal. “Congress has an opportunity to enact measures that will help put people back to work and make our economy more competitive for years to come,” said Stephen E. Sandherr, the association’s chief executive officer. “Making our ports more efficient, our bridges safer and our roads less congested will allow American businesses to be more competitive, our products more affordable and our economy more robust.”
The final line item in Table I is the producer price index (PPI) of commodities also reported by the BLS on a monthly basis. We regard this as a leading index of industrial construction. An increase in commodity prices, such as petroleum products, spurs a whole range of steel consuming activities from processing plants to pipelines. The PPI of commodities is a huge catch-all which is correlated with industrial construction of the following: oil and gas production, terminals and transmission, alternative fuels, petroleum refining, chemical processing, metals and minerals, pulp paper and wood, industrial manufacturing and pharmaceuticals plants. Industrial construction has fared much better than non residential buildings both during and after the recession. In 2011 and 2012 growth averaged 30 percent but has slowed in 2013. However industrial construction activity is at the pre-recession level today and is a huge consumer of all steel products.
In summary, we believe that construction will consume about 23 million tons of steel products this year. At SMU we compare steel consumption with several benchmarks and in all cases find consumption to be below the benchmark standard. We believe this discrepancy to be caused by the slow recovery of construction. Manufacturing has been the driver in the last three years and construction has been the drag. We expect this situation to continue for the next few years.


