

Prices

December 5, 2013
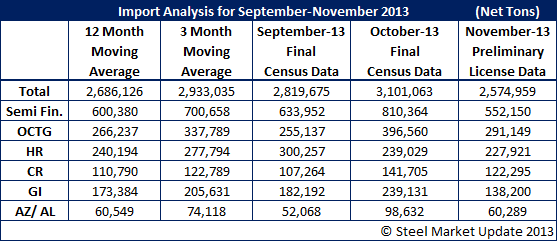
October Imports at Yearly High
Written by Brett Linton
Final October import data was released earlier this week, showing total imports for the month at 3,101,063 net tons (2,813,240 metric tons). This figure is the highest tonnage seen since April 2012 when imports were 3,144,947 NT (2,853,051 MT). Total October imports are well above both the 3 and 12 month-moving-averages (MMA). Compared to September, October imports are up 9.98 percent.
Based on Preliminary License Data, November imports are forecast to drop significantly to approximately 2,574,959 net tons which is 226,104 net tons lower than the October final total.
Semi finished imports were at 810,364 NT in October, up 27.83 percent compared to the month prior. Tonnage in October was above both the 3MMA and 12MMA. November preliminary data currently has semifinished imports at 552,150 NT.
Oil country tubular goods (OCTG) imports in October were at 396,560 NT, a 55.43 percent increase over September. Tonnage in October was above both the 3MMA and 12MMA. November preliminary data currently has OCTG imports at 291,149 NT.
Hot rolled imports were at 239,029 NT in October, the only product we follow that was down compared to the month prior (by 20.39 percent). Tonnage in October was below both the 3MMA and 12MMA, but only below the 12MMA slightly. November preliminary data currently has hot rolled imports at 227,921 NT.
Cold rolled imports were at 141,705 NT in October, up 32.11 percent compared to the month prior. Tonnage in October was above both the 3MMA and 12MMA. November preliminary data currently has cold rolled imports at 122,295 NT.
Galvanized imports in October were at 239,131 NT, a 31.25 percent increase over September. Tonnage in October was above both the 3MMA and 12MMA. November preliminary data currently has galvanized imports at 138,200 NT.
Other metallic coated imports were at 98,632 NT in October, up 89.43 percent compared to the month prior. Tonnage in October was above both the 3MMA and 12MMA. November preliminary data currently has other metallic coated imports at 60,289 NT.
To compare steel imports, steel exports, domestic mill production, or the SMU Steel Buyers Sentiment Index to any of the pricing series provided by Steel Market Update, feel free to use our Interactive Graphing Tool by going to our homepage, hovering over the Pricing Tab, and clicking on Price History.


