

Market Data
January 16, 2014
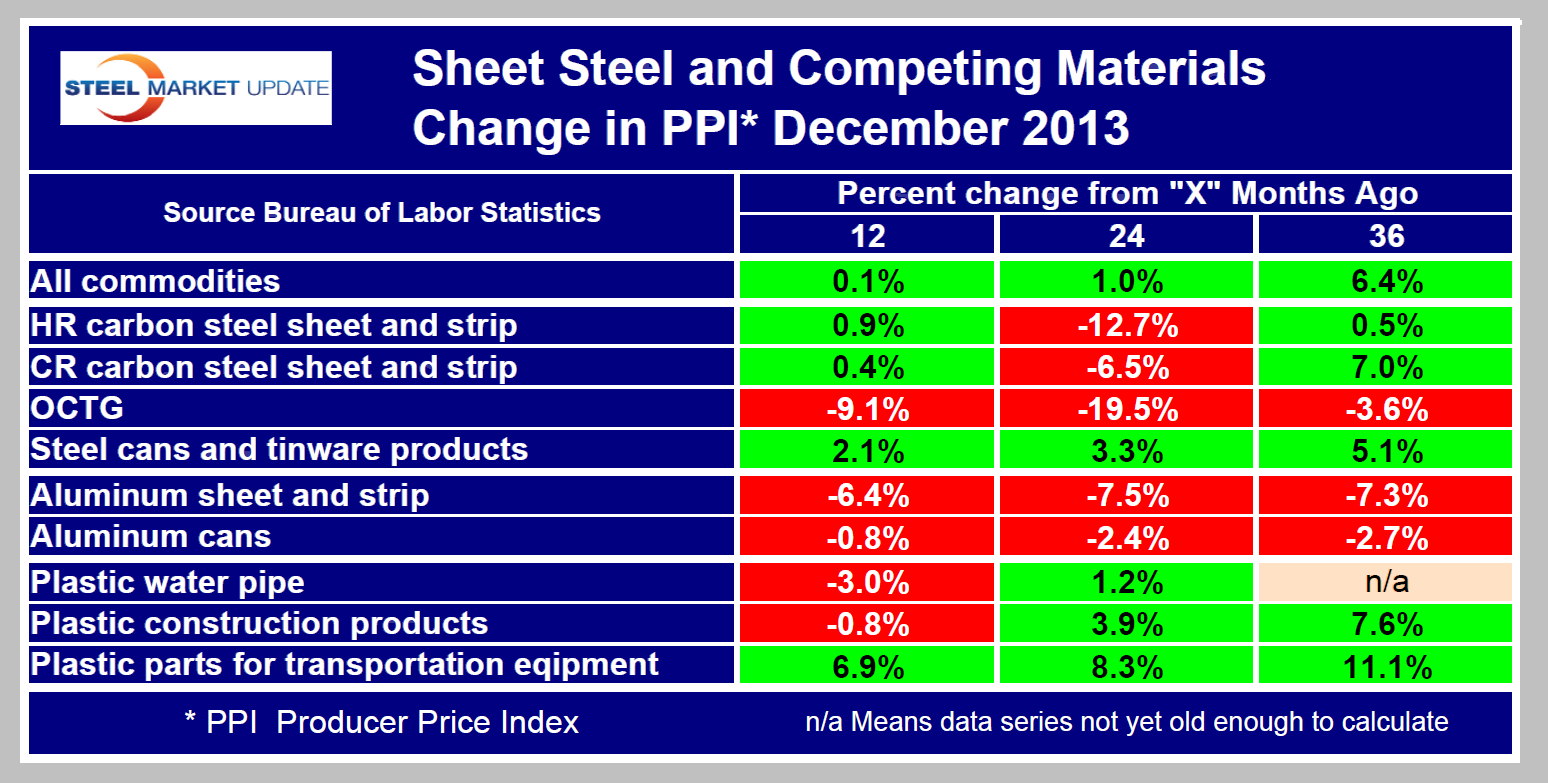
Producer Price Indexes of Sheet Steel and Competing Materials
Written by Peter Wright
Each month the Bureau of Labor Statistics puts out its series of producer price indexes (PPI), for thousands of goods and materials. The latest release on Wednesday reported December results. These statistics are a useful way to evaluate any changes in the competitive position of steel against competing materials. See below for the official description of this program. Overall prices for finished goods declined 0.1 percent in November and 0.2 percent in October. At the earlier stages of processing, prices received by producers of intermediate goods rose 0.6 percent in December, and the crude goods index climbed 2.4 percent. On an unadjusted basis, prices for finished goods increased 1.2 percent in 2013 compared with a 1.4 percent advance in 2012.
For the purpose of this report, SMU extracts comparative statistics for sheet steel, aluminum and plastic products. Table 1 is a summary of steel, aluminum and plastic indexes on a year over one, two and three year’s basis. One cell in this table contain the code n/a. In the last two years the BLS has expanded its range of products within the PPI series with the result that long term comparisons can not yet be made in this product. What the PPI data shows is that the acceleration in commodity prices slowed to 0.1 percent in 12 months through December. Over a 24 month period commodity prices were up by 1.0 percent and by 6.4 percent over 36 months. The price gyrations of hot and cold rolled sheet don’t bear much relation to the overall commodity grouping. Of special note this week, considering the news from the Detroit auto show, is that the price index of aluminum sheet has declined 6.4 percent in the last year and that decline is accelerating. At the same time the PPI of cold rolled sheet has risen by 0.4 percent. No doubt Ford has decided that long term energy costs in the US will remain low which will have a beneficial effect on the long term price of aluminum. In order to meet government mandated fleet economy ratings the automobile manufacturers are taking the vehicle weight issue very seriously. Ultra high strength steels are competing head to head with aluminum and winning some as they lose others. The future energy economy of the US could work against the competitive position of steel. The price of steel cans and tin ware products is steadily becoming less competitive against aluminum.
The PPI data are helpful in monitoring the competitive price of steel and steel products against competing materials and products. As far as we at SMU can tell from comparison with known transaction prices, these PPI are a good representation of the real world.
The official description from the Bureau of Labor Statistics (BLS) reads as follows: “The Producer Price Index (PPI) is a family of indexes that measure the average change over time in the prices received by domestic producers of goods and services. PPIs measure price change from the perspective of the seller. This contrasts with other measures, such as the Consumer Price Index (CPI). CPIs measure price change from the purchaser’s perspective. Sellers’ and purchasers’ prices can differ due to government subsidies, sales and excise taxes, and distribution costs. More than 9,000 PPIs for individual products and groups of products are released each month. PPIs are available for the products of virtually every industry in the mining and manufacturing sectors of the U.S. economy. New PPIs are gradually being introduced for the products of industries in the construction, trade, finance, and services sectors of the economy. More than 100,000 price quotations per month are organized into three sets of PPIs: (1) Stage-of-processing indexes, (2) commodity indexes, and (3) indexes for the net output of industries and their products. The stage-of processing structure organizes products by class of buyer and degree of fabrication. The commodity structure organizes products by similarity of end use or material composition. The entire output of various industries is sampled to derive price indexes for the net output of industries and their products.
“Stage-of-Processing Indexes: Within the stage-of-processing system, finished goods are commodities that will not undergo further processing and are ready for sale to the final-demand user, either an individual consumer or business firm. Finished consumer goods include durable goods such as automobiles, household furniture, and appliances, as well as nondurable goods such as apparel and home heating oil. Capital equipment includes durable goods such as heavy motor trucks, tractors, and machine tools.
“The stage-of-processing category for intermediate materials, supplies, and components consists partly of commodities that have been processed but require further processing. Examples of such semi finished goods include flour, cotton yarn, steel mill products, and lumber. The intermediate goods category also encompasses nondurable, physically complete items purchased by business firms as inputs for their operations. Examples include diesel fuel, belts and belting, paper boxes, and fertilizers.
“Crude materials for further processing are products entering the market for the first time that have not been manufactured or fabricated and that are not sold directly to consumers. Crude foodstuffs and feedstuffs include items such as grains and livestock. Examples of crude nonfood materials include raw cotton, crude petroleum, coal, hides and skins, and iron and steel scrap.”


