

Market Data
February 9, 2014
Net Job Creation through January 2014
Written by Peter Wright
Friday’s report has been well publicized as disappointing at 113,000 jobs created especially following the December result at 76,000. Less well appreciated is that the January report made revisions to data on payrolls, the workweek and earnings going back to 2009. Revisions to this data, which is drawn from a survey of employers, showed 369,000 more jobs than previously thought were created in the 12 months through March 2013, on a seasonally adjusted basis and in addition November’s data was revised up by 35,000. This was the second upward revision to November which was also revised up in the December report, then by 38,000.
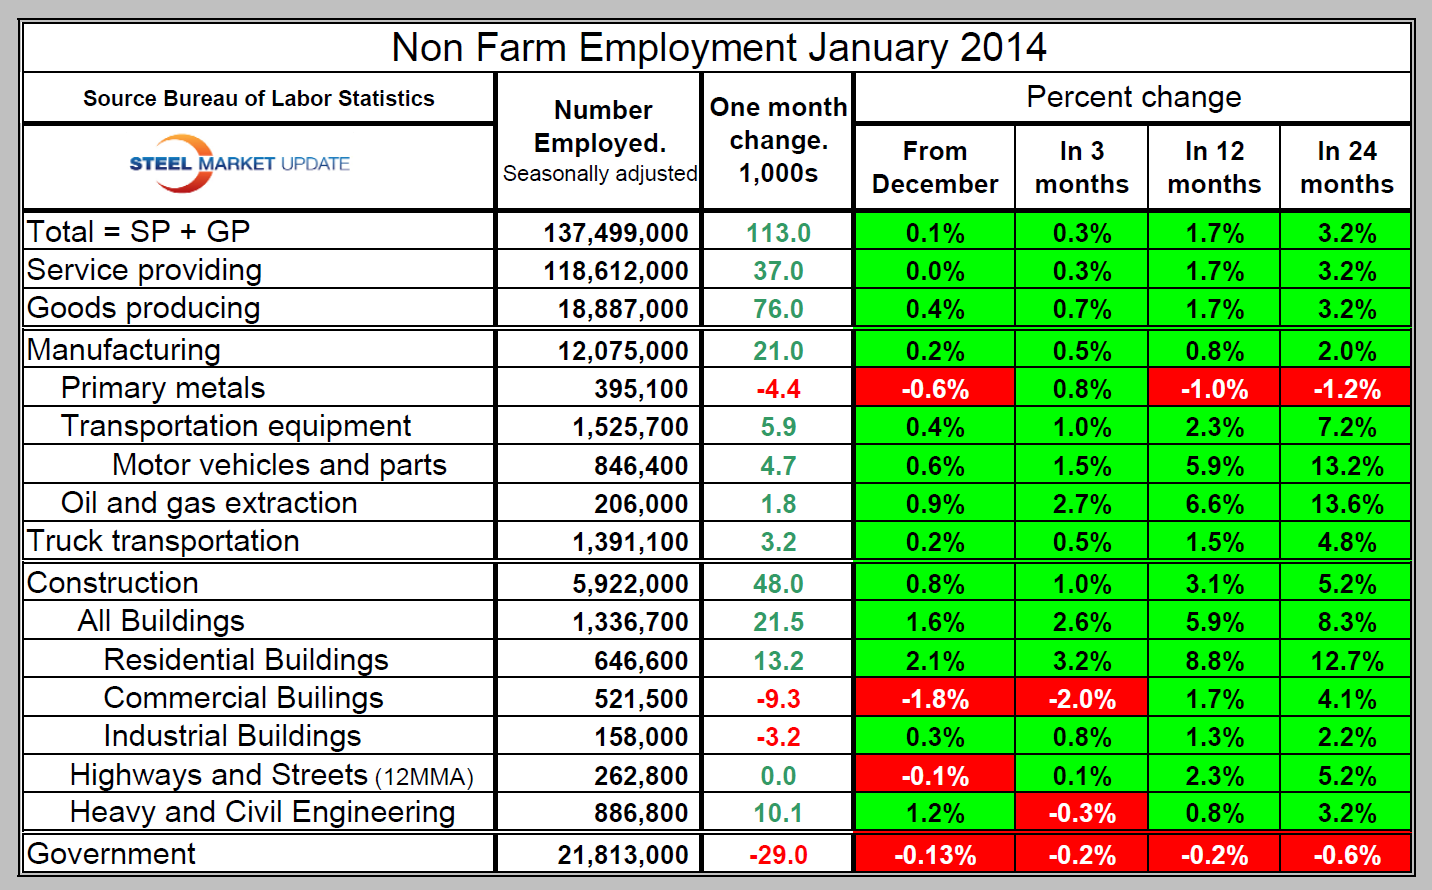
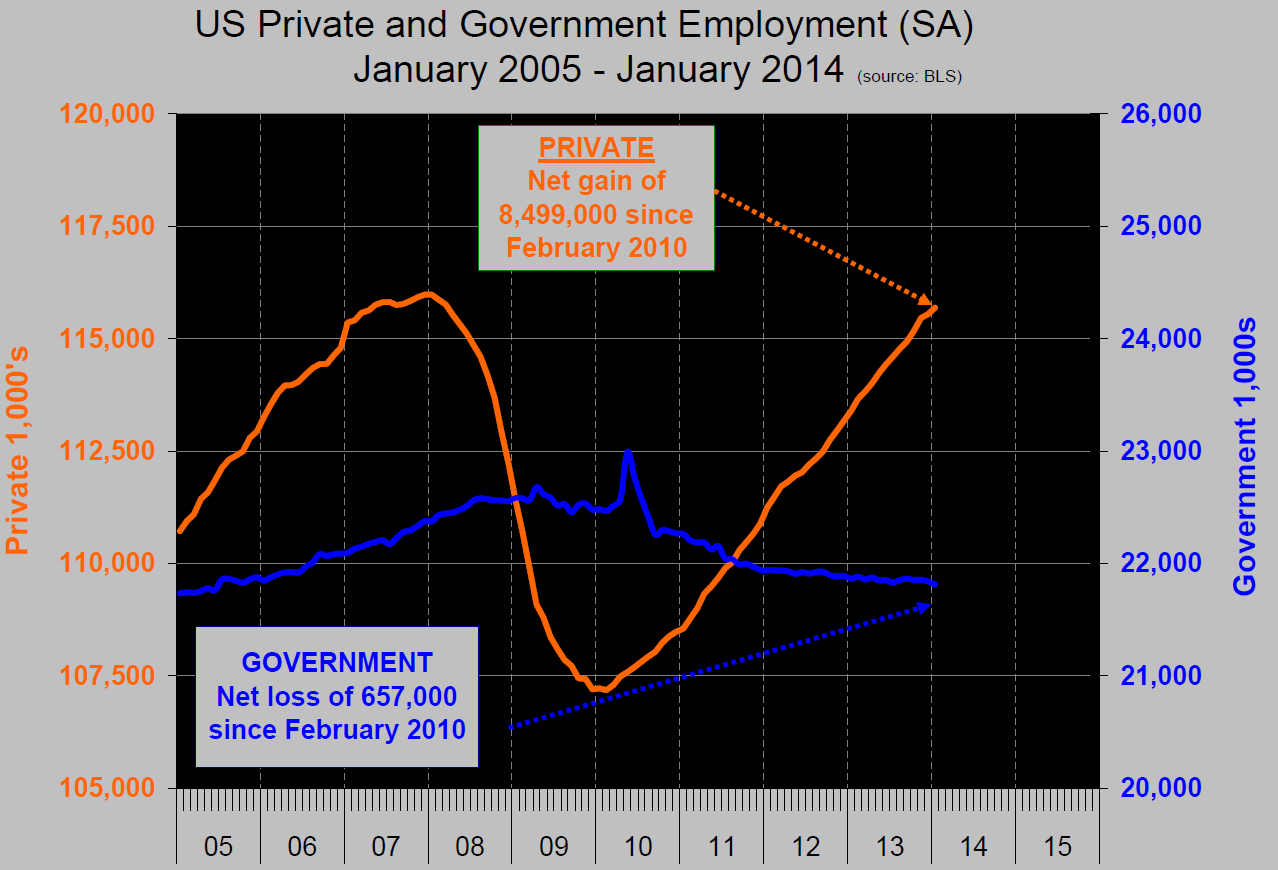 The disappointing December data was blamed on short term influences such as unusually cold weather but strangely, January weather was also miserable in many areas and construction job creation was the highest since 2007. Something doesn’t compute. However based on the data available SMU has performed its regular monthly analysis. January was only the second month in over three years when the creation of “Goods producing” jobs which is mainly construction and manufacturing exceeded “Service providing.” It was also the best performance for goods producing industries since January 2006. Therefore on the face of it the January report was the best result for steel in seven years. Table 1 itemizes some of the sub sectors on manufacturing and construction and also includes numbers for transportation and government. Of concern is that commercial building construction has shed jobs in four of the last five months tending to support the contraction in private non residential construction reported by the Commerce Department in their “Construction Put in Place” data. Since the employment picture turned around in February 2010, the private sector has added 8,499,000 jobs and government has shed 657,000 (Figure 1).
On Thursday the Bureau of Labor Statistics (BLS) released their report on productivity and costs for Q4 2013. Main comments were as follows; “Nonfarm business sector labor productivity increased at a 3.2 percent annual rate during Q4 2013. The increase in productivity reflects increases of 4.9 percent in output and 1.7 percent in hours worked. (All quarterly percent changes in this release are seasonally adjusted annual rates.) From Q4 2012 to Q4 2013, productivity increased 1.7 percent as output and hours worked rose 3.3 percent and 1.6 percent, respectively. Labor productivity, or output per hour, is calculated by dividing an index of real output by an index of hours worked of all persons, including employees, proprietors, and unpaid family workers. Unit labor costs in nonfarm businesses decreased 1.6 percent in Q4 2013, as the 3.2 percent increase in productivity was larger than a 1.5 percent increase in hourly compensation. Unit labor costs fell 1.3 percent over the last four quarters. BLS defines unit labor costs as the ratio of hourly compensation to labor productivity; increases in hourly compensation tend to increase unit labor costs and increases in output per hour tend to reduce them. Manufacturing sector productivity increased 2.0 percent in Q4 2013, as output and hours worked increased 6.6 percent and 4.4 percent, respectively. Productivity increased 3.4 percent in the durable goods sector and increased 1.0 percent in the non-durable goods sector. Over the last four quarters, manufacturing productivity increased 2.1 percent, as output increased 3.3 percent and hours increased 1.2 percent. Unit labor costs in manufacturing declined 0.9 percent from the same quarter a year ago.
The January statement by the Bureau Of labor Statistics on net job creation, abbreviated by SMU reads as follows:
“Nonfarm payroll employment increased by 113,000 in January, and the unemployment rate, at 6.6 percent, changed little. Private-sector employment grew by 142,000. Employment rose in construction, manufacturing, wholesale trade, and mining. Construction added 48,000 jobs in January, more than offsetting a loss in December. In January, employment rose in both residential and nonresidential building (+13,000 and +8,000, respectively) and in nonresidential specialty trade contractors (+13,000). Heavy and civil engineering construction added 10,000 jobs. Manufacturing employment increased by 21,000 in January. Job gains occurred in machinery (+7,000), wood products (+5,000), and motor vehicles and parts (+5,000). In 2013, employment growth in manufacturing averaged 7,000 per month. Mining employment increased by 7,000 in January. In 2013, employment growth in mining averaged 2,000 per month.
Federal government employment declined by 12,000 in January. Over the past 12 months, federal government employment has decreased by 85,000, or 3.0 percent.
average hourly earnings of all employees on private nonfarm payrolls rose by 5 cents in January to $24.21. Over the past 12 months, average hourly earnings have risen by 1.9 percent. From December 2012 to December 2013, the Consumer Price Index for All
Urban Consumers (CPI-U) increased by 1.5 percent.
The establishment survey data released today reflect the incorporation of annual benchmark revisions. Each year, we re-anchor our sample-based survey estimates to full universe
counts of employment, primarily derived from administrative records of the unemployment insurance tax system. The level of nonfarm payroll employment in March 2013 was revised up by 347,000 (not seasonally adjusted) or 0.3 percent. The average benchmark revision over the past 10 years was plus or minus 0.3 percent.
In January, both the unemployment rate, at 6.6 percent, and the number of unemployed persons, at 10.2 million, changed little. The unemployment rate has declined by 0.6 percentage point since October. In January, the number of persons jobless for 27 weeks and over declined by 232,000 to 3.6 million, or 35.8 percent of total unemployment.
The labor force participation rate edged up to 63.0 percent in January. The employment to population ratio increased to 58.8 percent. Among the employed, the number of persons working part time for economic reasons fell by 514,000 to 7.3 million. These individuals would have preferred full-time employment, but had their hours cut or were unable to find full-time work.”
SMU Comment: Employment is one of the key foundation stones of future steel demand as it drives consumer confidence and spending. We are not depressed about the December and January results as the long term fundamentals are still strong. Moody’s Analytics expects that once the snow melts and temperatures rise, monthly payroll gains will rise to better than 200,000 per month in line with the strong addition of 274,000 added in November.


