

Market Data
April 7, 2014
Net Job Creation through March 2014
Written by Peter Wright
The Bureau of Labor Statistics (BLS) report on non-farm employment came close to expectations in March with a net gain of 192,000 jobs. In addition January and February were revised up by 15,000 and 22,000 respectively. The three month moving average, (3MMA) rose to 178,000 after declining for three straight months (Figure 1).
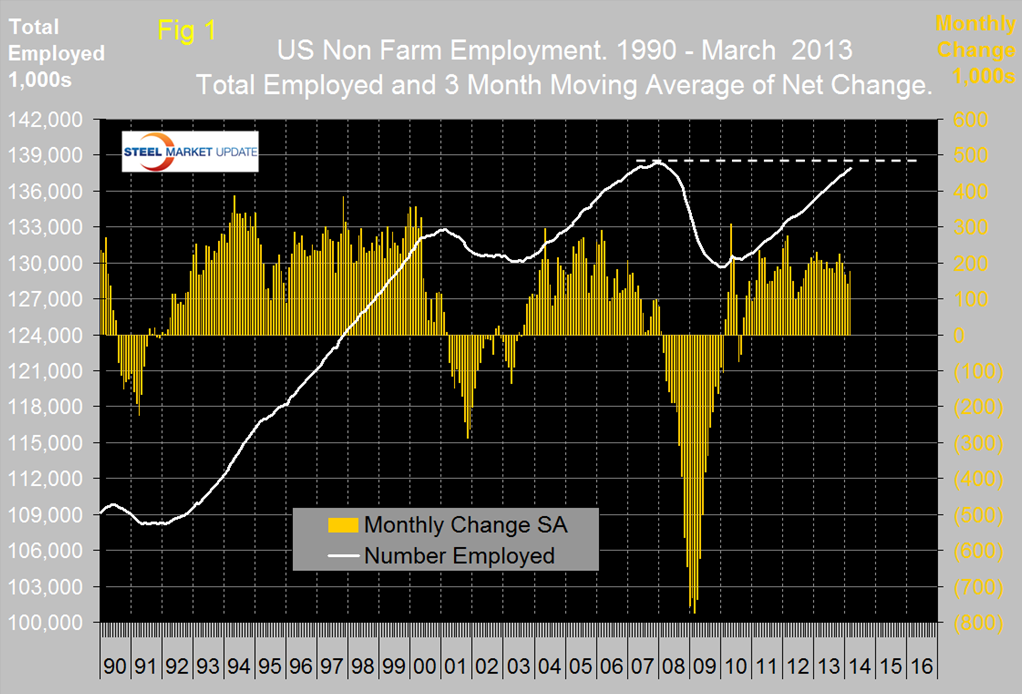
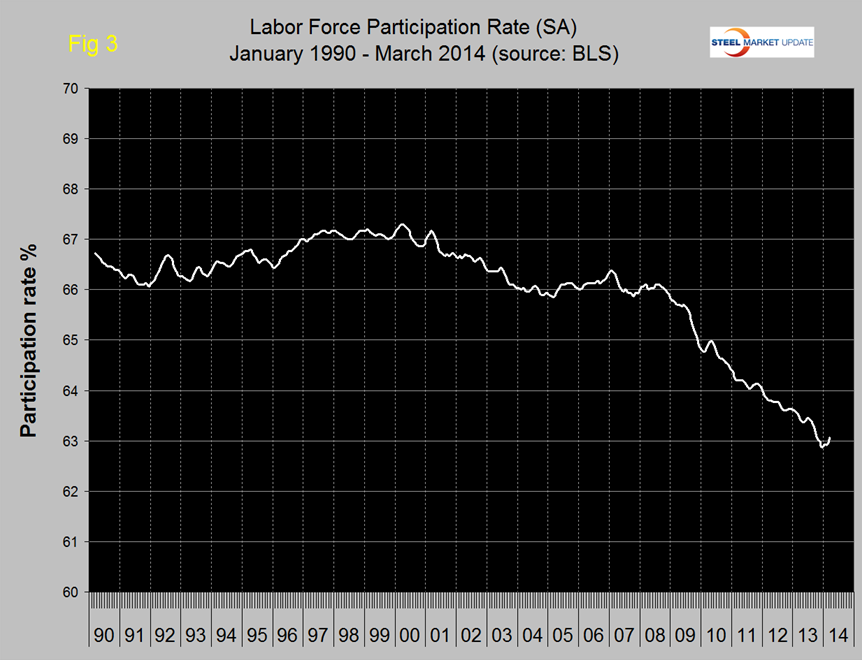
The growth trajectory is still on track to meet the pre-recessionary peak of total employed by the middle of this year and in March private sector employment did exceeded the pre-recessionary peak of January 2008 by 110,000. However the underlying level of participation rate and under-employed has a very long way to go to absorb entrants to the working age population since 2008. On Saturday the WSJ reported that an additional 7.2 million jobs are needed to keep pace with population growth since the recession. A total of 167,000 jobs were created in service industries in March and 25,000 in goods producing. The percentage growth of both service and production employment has been the same in one month and twenty four month periods. Of the net new goods producing jobs gained in February, 19,000 were in construction as manufacturing lost 1,000 (Table 1). All of the 192,000 jobs created in March were in the private sector as government employment was unchanged.
The regional net job creation results for February were released in late March and showed growth in most of the country. This data is compiled by the states independent of the federal government. Other than the Northeast which is still recovering from the unusual winter weather every region added to employment in February.
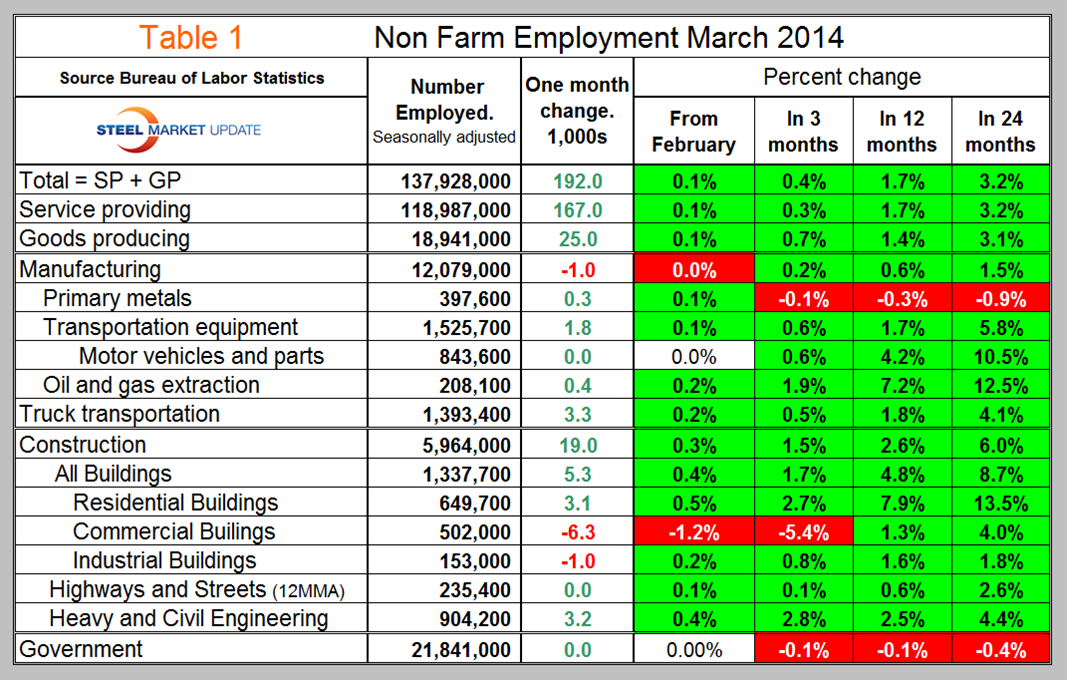
New figures released Thursday by global outplacement consultancy Challenger, Gray & Christmas, Inc. show employers announced the fewest first-quarter job cuts in 19 years, providing further evidence that the economy continues to gain strength as it enters the sixth year of recovery. Job cuts in March were 34,399, 18 percent lower than the 41,835 February result and 30 percent lower than a year ago when March job cuts totaled 49,255 (Figure 2). Through the first quarter of 2014, employers announced 121,341 job cuts, down 16 percent from the 145,041 cuts tracked during the first three months of 2013. This was the lowest Q1 total since 1995, when 97,716 job cuts were announced. First quarter job cuts were led by the retail sector, where employers announced 18,231 job cuts through the first three months of 2014, including 2,989 in March. The financial sector follows closely with 15,306 job cuts announced over the first three months of 2014. There continue to be job cuts in the health care sector, as hospitals adjust to lower Medicare reimbursements and cutbacks in Medicaid funding.
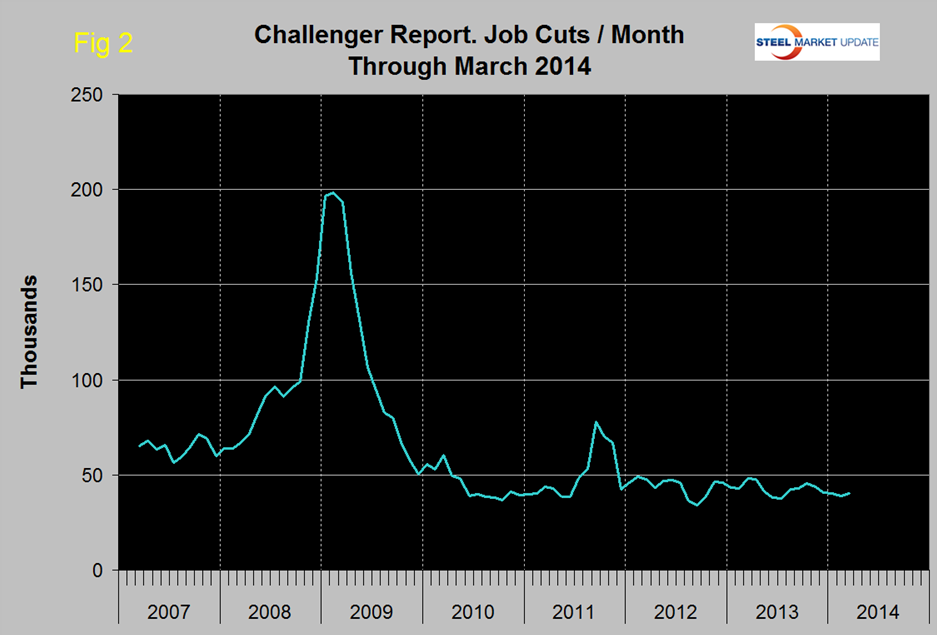
In March the participation rate increased slightly to 63.1 percent a far cry from its recent peak of 67.3 percent in Q1 2000 but up from 62.8 percent in December (Figure 3).
The official report of the BLS and abridged by SMU reads as follows:
Total nonfarm payroll employment rose by 192,000 in March. Job growth averaged 183,000 per month over the prior 12 months. In March, employment grew in professional and business services, in health care, and in mining and logging.
Professional and business services added 57,000 jobs in March, in line with its average monthly gain of 56,000 over the prior 12 months. Within the industry, employment increased in March in temporary help services (+29,000), in computer systems design and related services (+6,000), and in architectural and engineering services (+5,000).
In March, health care added 19,000 jobs. Employment in ambulatory health care services rose by 20,000, with a gain of 9,000 jobs in home health care services. Nursing care facilities lost 5,000 jobs over the month. Job growth in health care averaged 17,000 per month over the prior 12 months.
Employment in mining and logging rose in March (+7,000), with the bulk of the increase occurring in support activities for mining (+5,000). Over the prior 12 months, the mining and logging industry added an average of 3,000 jobs per month.
Employment continued to trend up in March in food services and drinking places (+30,000). Over the past year, food services and drinking places has added 323,000 jobs.
Construction employment continued to trend up in March (+19,000). Over the past year, construction employment has risen by 151,000.
Employment in government was unchanged in March. A decline of 9,000 jobs in federal government was mostly offset by an increase of 8,000 jobs in local government, excluding education. Over the past year, employment in federal government has fallen by 85,000.
Employment in other major industries, including manufacturing, wholesale trade, retail trade, transportation and warehousing, information, and financial activities, changed little over the month.
The average workweek for all employees on private nonfarm payrolls increased by 0.2 hour in March to 34.5 hours, offsetting a net decline over the prior 3 months. The manufacturing workweek rose by 0.3 hour in March to 41.1 hours, and factory overtime rose by 0.1 hour to 3.5 hours. The average workweek for production and nonsupervisory employees on private nonfarm payrolls increased by 0.3 hour to 33.7 hours.
In March, average hourly earnings for all employees on private nonfarm payrolls edged down by 1 cent to $24.30, following a 9 cent increase in February. Over the year, average hourly earnings have risen by 49 cents, or 2.1 percent.
In March, average hourly earnings of private-sector production and nonsupervisory employees edged down by 2 cents to $20.47.
The change in total nonfarm payroll employment for January was revised from +129,000 to +144,000, and the change for February was revised from +175,000 to +197,000. With these revisions, employment gains in January and February were 37,000 higher than previously reported.


