Prices

April 14, 2014
Shipments of Sheet and Strip Products through February 2014
Written by Peter Wright
Total shipments of sheet and strip steel products, including hot rolled, cold rolled and all coated products, were down by 3.5 percent YTD compared to the first two months of 2013. In the period December through February compared to the previous three months, the total tonnage was down by 2.3 percent.
Comparing YTD shipments for 2014 and 2013 for individual products, hot band was down by 4.0 percent and cold rolled by 6.2 percent. There were big differences in the performance of coated products YTD. Hot dipped galvanized was up by 1.4 percent, electro galvanized declined by 3.4 percent and other metallic coated, mainly galvalume took a major hit being down by 23.2 percent (Table 1).
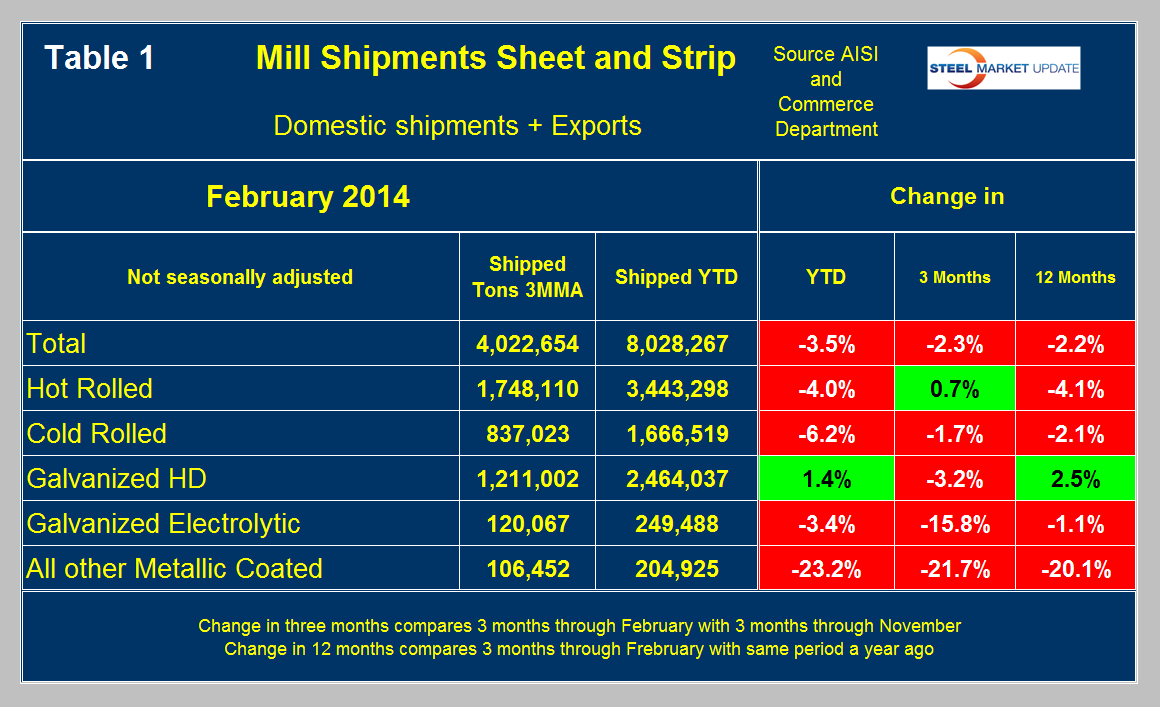
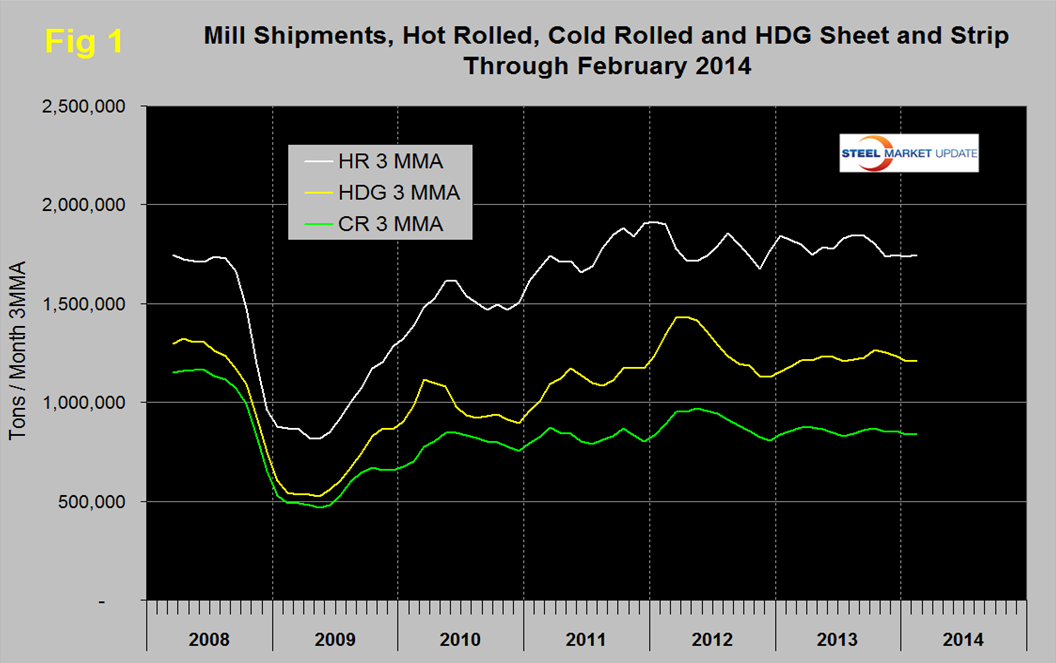
Figure 1 shows a six year trend for hot rolled, cold rolled and HDG. Following the post recession recovery, hot rolled has been little changed for two years. Shipments of hot dipped galvanized sheet and strip declined strongly in Q2 through Q4 2012 but made up a third of that loss in 2013. Cold rolled shipments have shown little direction for over 12 months. This analysis is based on shipments to domestic locations plus exports and uses the AISI AIS10 monthly report and Commerce Department trade data.
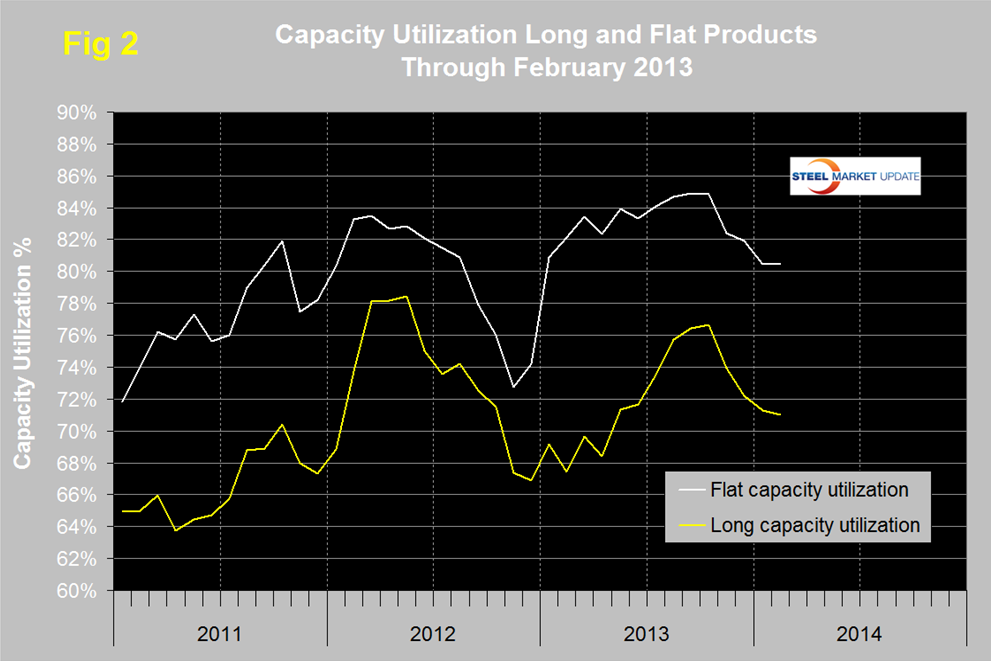
Last week we discovered a flaw in the logic that we use to determine the capacity utilization of the flat rolled mills. This has increased the result that we will report in the future and demonstrated the better performance of flat rolled mills compared to long product mills (Figure 2). The revised logic is as follows: Calculate total steel mill capacity using the crude production tonnage divided by capacity utilization reported by AISI weekly. Multiply that number by 0.9 to get the rolled product capacity. This is an industry approximation, integrated hot mills with thick slab feed have a lower mill yield than thin slab direct rolled mills. Subtract the rolled product capacity of the long product mills which we feel we have a good handle on from SMA data which leaves flat rolled capacity. Then calculate flat rolled capacity utilization using shipment data from the AISI AIS10 report. Note the resulting utilization rate is for rolled products not for crude steel. Please feel free to challenge this logic if you see fit. This is definitely not an exact science.