

Analysis
June 3, 2014
Construction Expenditures through April 2014
Written by Peter Wright
Each month the Commerce Department issues its construction put in place (CPIP) data on the first working day covering activity two months earlier. April data was released on June 2nd.
Total Construction: Data is reported on both a seasonally adjusted and non-adjusted basis. In the SMU analysis we consider only the non-adjusted data and remove seasonality by the consideration of year over year (y/y) data. We also focus on rolling 3 and 12 month data to remove the noise in singly month numbers. April expenditures were $76.263 billion which breaks down to $55.806 B of private work, $18.552 B state and locally financed and $1.905 B of Federal expenditures, (Table 1).
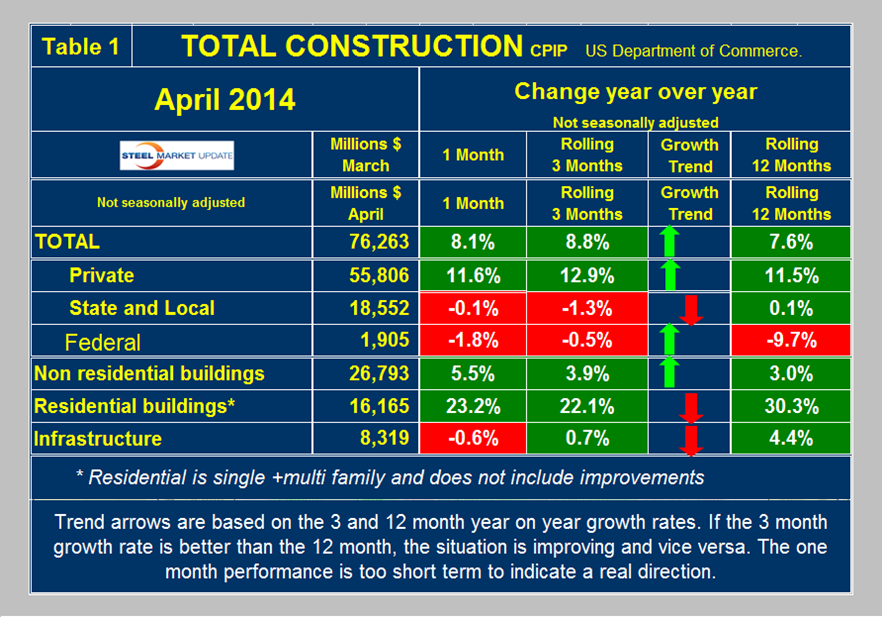
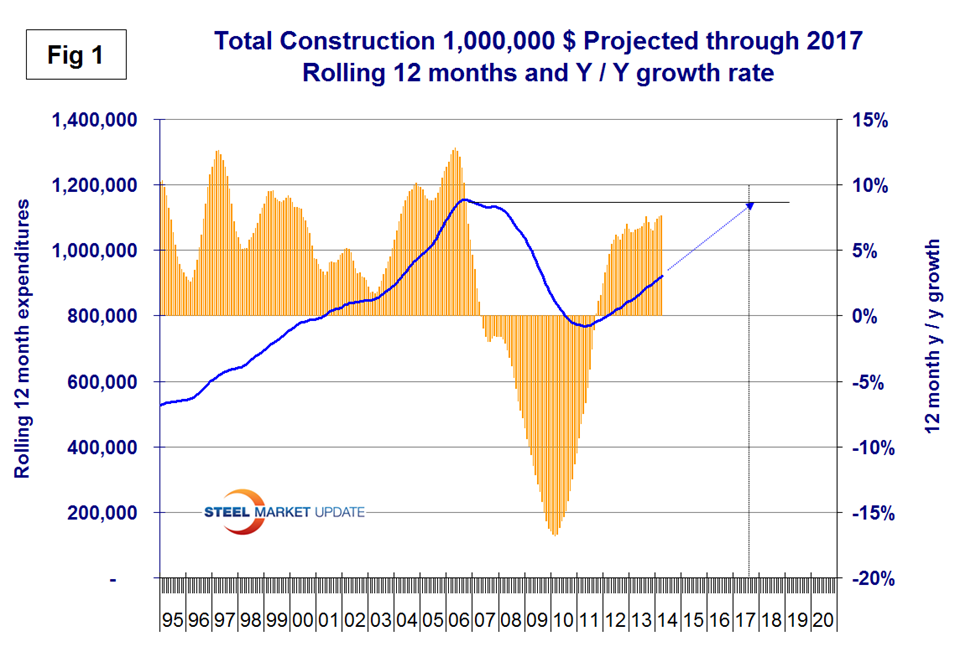
Federal expenditures picked up slightly in April but on a rolling 12 month basis y/y were down by 9.7 percent. The Federal sector is so small as to be of little interest to us as we review the big picture. On a rolling three month basis total construction was up by 8.8 percent y/y and was up by 7.6 percent on a rolling 12 months y/y. This means that total construction growth is accelerating since the short term growth (3 months) is greater than the long term, (12 months). Note, this is not a seasonal effect because our y/y analysis removes seasonality. Private work has positive momentum but state and local momentum was negative in the April results. We consider three sectors within total construction. These are non-residential, residential and infrastructure. On a rolling three month basis y/y non-residential is growing at 3.9 percent and accelerating. Residential is growing at 22.1 percent and slowing. Infrastructure grew 0.7 percent y/y in the last three months and slowed from the rapid acceleration that we reported last month. The growth of total construction has been fairly steady for over 18 months but it will be Q3 2017 before the pre-recessionary peak is regained, (Figure 1). The pre-recession peak of total construction on a rolling 12 month basis was $1,145 B in 12 months through February 2007. The low point was $768 B in 12 months through May 2011. The 12 month total through the latest data of April 2014 was $922 B. This means that recovery has only been 41 percent in three years of positive growth.
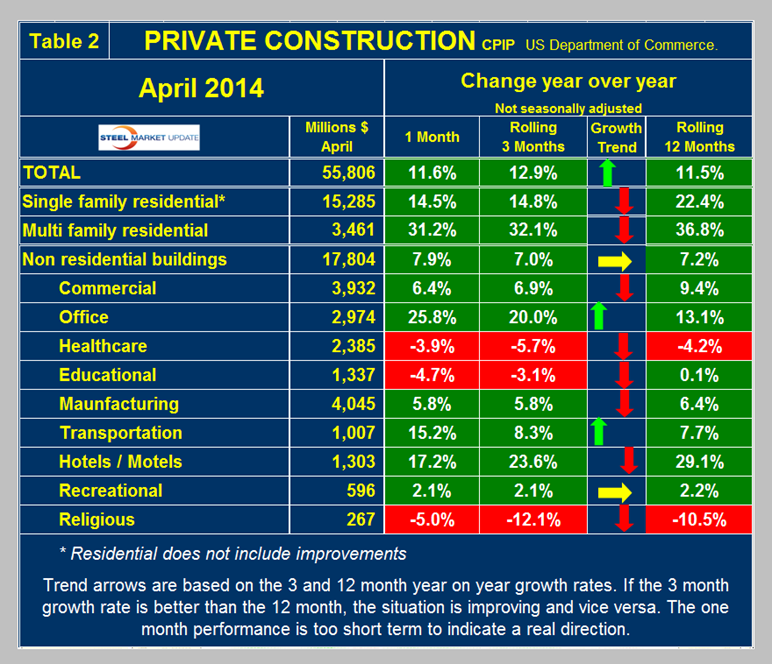
Private Construction: Private work accelerated slightly from an 11.5 percent growth rate in 12 months y/y to an 12.9 percent rate in 3 months y/y, (Table 2).
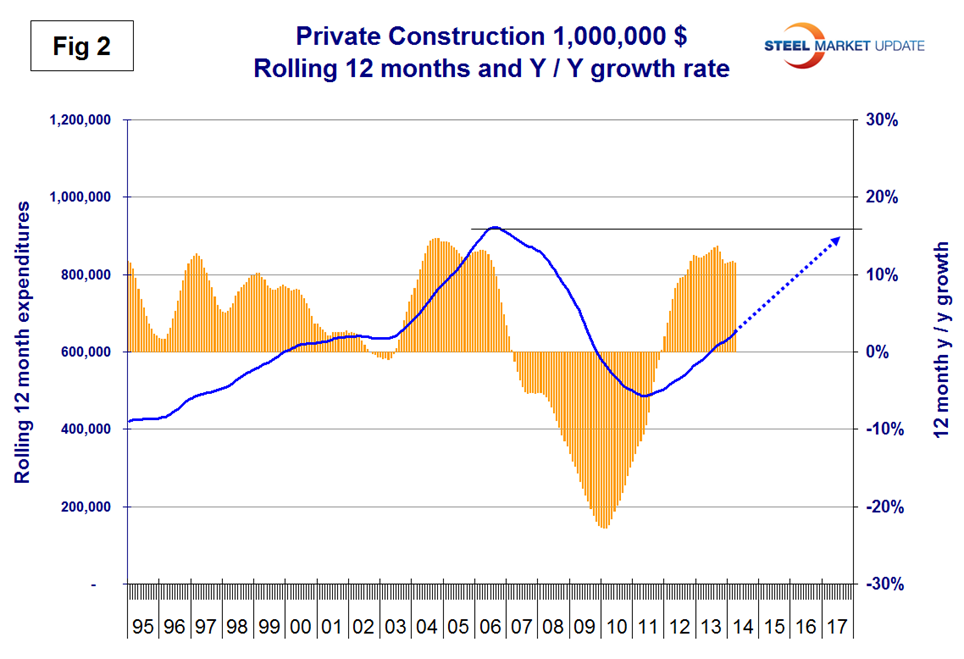
The growth of private work has exceeded 10 percent for the last 20 months but at the current rate it will be mid 2017 before recovery is complete, (Figure 2). Table 2 breaks down the private sector into project types. Residential buildings, both single and multi-family are growing rapidly though slowing. This data coincides well with the housing starts data that SMU reports every month. At SMU we regard the housing situation as both critical to the economic recovery and poorly understood. It appears that a seismic shift may be underway in the population’s attitude to the roof over their heads.
On Monday this week the S&P Dow Jones Indices – Housing Views housingviews@gmail.com made the following observations. “The two most popular comments about the housing recovery are that it’s weak and the reason why GDP growth is so slow. There is some truth to both of these — the problem is new single family homes. Looking across housing, one sees surprisingly strong construction of apartments, progress in working through the backlog of foreclosures as banks sell real estate they don’t want to own and increasing sales of existing homes. Prices of existing single family homes, helped by low mortgage rates and improved consumer confidence rose 12.5 percent in the year ending in March. All this is positive, but without growth in new single family homes, GDP growth lags. New construction, not sales of existing homes, is what generates jobs and adds to GDP growth. In most recoveries, the share of single family homes in housing starts surges. This time, there was an initial surge followed by a sharp drop. While apartment construction is up, it has not made up the difference in housing starts which continue at about two-thirds the level we should be seeing. There are lots of reasons, but no one big reason for the softness. Mortgages rates are low, but banks are still reticent about loans. Many potential home buyers may have little borrowing capacity due to recent car purchases or student debts. The New York Times noted that the number of foreclosed homes sold by banks has been substantially greater than the number of new homes sold by builders in recent years. While these factors will be resolved over time, there are questions about demographic shifts that could mean less building of single homes in the future. Will people prefer renting to buying because they expect their employment to change more often or will their preferences shift to urban living from suburbia? As the baby boomers begin to retire, will they ignore retirement communities and head to new downtowns in revived cities? This may seem farfetched to some observers. However, suburbia and universal car ownership didn’t really exist before the Second World War, so single family homes could change again.”
Private non-residential buildings are growing at a 7.0 percent rate with a slightly negative momentum. Within private non-residential, only health care and religious buildings are showing a sustained contraction. Offices and hotels/motels continue to show surprising strength with offices acceleration and accommodation slowing.
State and Local Construction: S&L work declined in the single month of April y/y and the rolling three months also decreased by 1.3 percent, (Table 3).
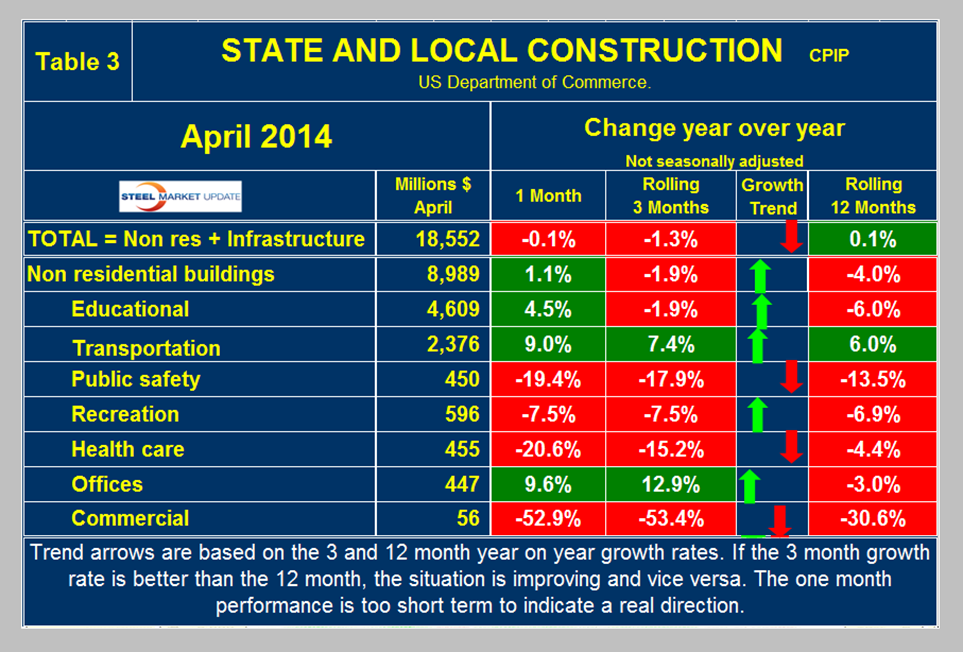
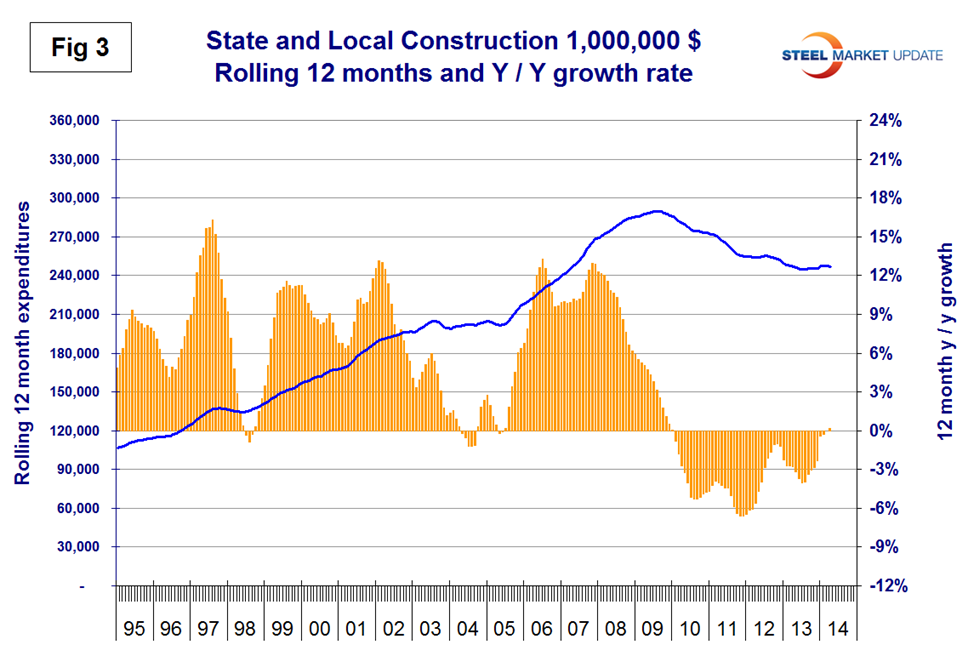
Overall state and local construction expenditures on a rolling 12 month basis appear to have bottomed out, (Figure 3). S&L non-residential building contracted 1.9 percent in three months through April y/y, but the contraction is slowing. Educational buildings are about 75 percent funded by state and local governments and are by far the largest sub sector of S&L non-residential at $4.6 billion in April but contraction continues with no end in sight. Transportation terminals continue to do well and office construction has had double digit growth in the last two months on a rolling three month basis. State fiscal balances are improving as income and sales tax revenues recover and property values/taxes increase. However, many state and local governments are far from healthy, as increased revenues have been more than offset by increased future obligations, including the need to replenish reserve and rainy-day funds and to service defined benefit liabilities, pensions foremost. Therefore, there is little room for increased public spending on all but the most essential categories. Considering the financial weakness of many sub-national governments, it will be many years before public construction catches up to pre-recession levels.
Drilling down into the private and S&L sectors as presented in Tables 2 and 3 shows which project types should be targeted for steel sales and which should be avoided. There are some project types within S&L that are doing quite well.
Infrastructure: The double digit growth rate of infrastructure that prevailed for each month in the first quarter on a rolling three month basis evaporated in April and momentum became negative. Bridge construction slowed which pushed the momentum of highway and streets to neutral, (Table 4).
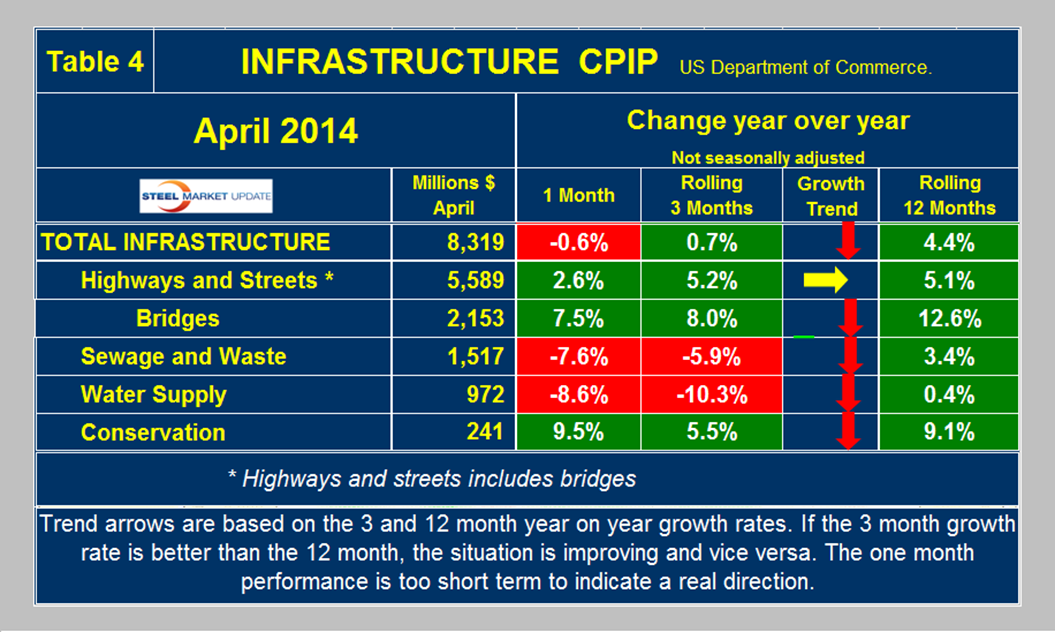
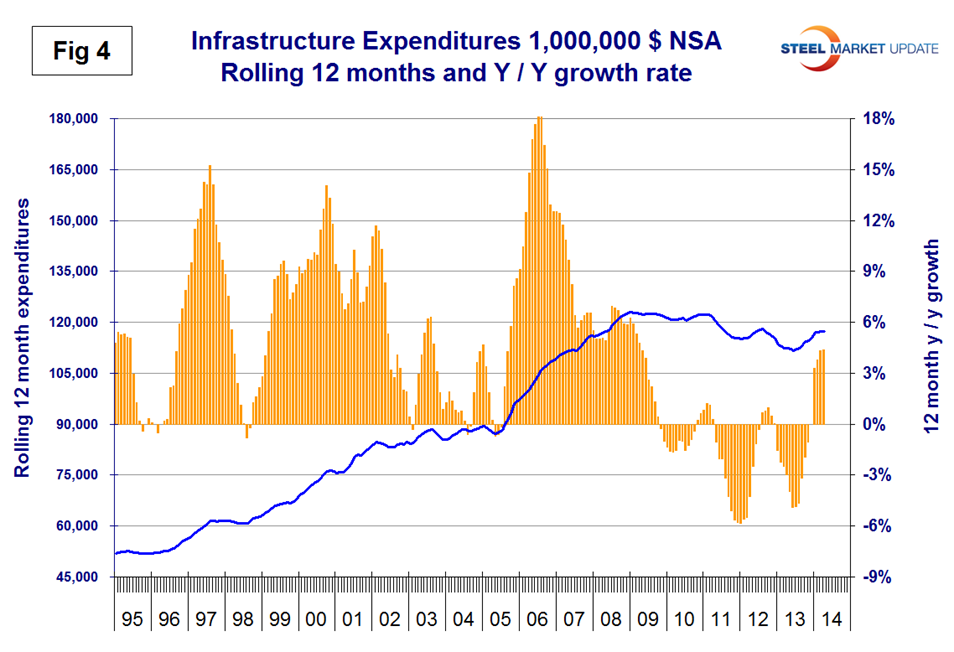
Water supply and sewage and waste continued to contract through April both with negative momentum. On a rolling 12 month basis, infrastructure expenditures grew at 4.4 percent y/y, (Figure 4).
The press release from the Commerce Department on Monday read as follows:
April 2014 Construction at $953.5 Billion Annual Rate
The U.S. Census Bureau of the Department of Commerce announced today that construction spending during April 2014 was estimated at a seasonally adjusted annual rate of $953.5 billion, 0.2 percent above the revised March estimate of $951.6 billion. The April figure is 8.6 percent above the April 2013 estimate of $878.4 billion. During the first 4 months of this year, construction spending amounted to $274.5 billion, 8.9 percent above the $252.1 billion for the same period in 2013.
Private Construction Spending on private construction was at a seasonally adjusted annual rate of $686.5 billion, nearly the same as the revised March estimate of $686.8 billion. Residential construction was at a seasonally adjusted annual rate of $378.5 billion in April, 0.1 percent above the revised March estimate of $378.3 billion. Nonresidential construction was at a seasonally adjusted annual rate of $308.0 billion in April, 0.1 percent below the revised March estimate of $308.5 billion.
Public Construction In April, the estimated seasonally adjusted annual rate of public construction spending was $267.0 billion, 0.8 percent above the revised March estimate of $264.8 billion. Educational construction was at a seasonally adjusted annual rate of $62.6 billion, 3.0 percent above the revised March estimate of $60.8 billion. Highway construction was at a seasonally adjusted annual rate of $81.3 billion, 1.1 percent below the revised March estimate of $82.2 billion.
Overall we at SMU continue to believe that private construction will continue to show strong growth until some presently unforeseen event derails it. Within the private sector, housing is the least understood. State and local non-residential building will muddle through with only the most critical projects being undertaken. The wild card is infrastructure expenditures, particularly highways and streets. The highway trust fund will be exhausted in Q3 2014.


