Market Segment
June 17, 2014
Service Center Intake, Shipments and Inventory in May 2014
Written by Peter Wright
Total service center carbon steel shipments in May declined by 56,600 tons to 3.584 million tons, April was the highest monthly shipping month since March two years ago. Shipping days in May were unchanged from April at 21. Tons per day (t/d) shipments declined from 173,300 in April to 170,600 in May, both on a non-seasonally adjusted basis. Table 1 shows the performance by product in May compared to the same month in previous years. Shipments of all products on a t/d basis were up by 8.0 percent from May last year as long products, particularly structurals continued to lag flat rolled and tubulars. Sheet products were up by 9.0 percent and plate by 7.9 percent.
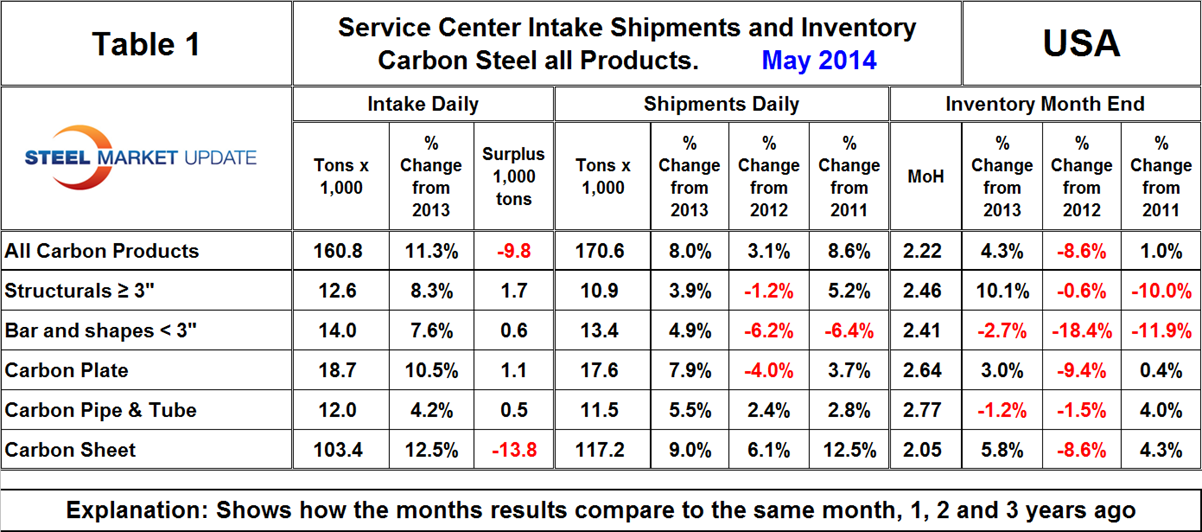
April was the highest intake month since January 2008 at 190,000 t/d so not surprisingly May intake was down and totaled 160,820 for all carbon products. This led to an intake deficit of 9,800 tons for the month and months on hand (MoH) fell from 2.24 to 2.22. In May there was a decline in the intake of sheet products after the April surge which led to an intake deficit of 13,800 tons for sheet. All other products had a surplus of intake.
Compared to the end of May last year, moth end inventories were up by 4.3 percent in total, with structurals leading the rate of increase. Sheet product inventories were up by 5.8 percent year over year but MoH only reached 2.05 at month end.
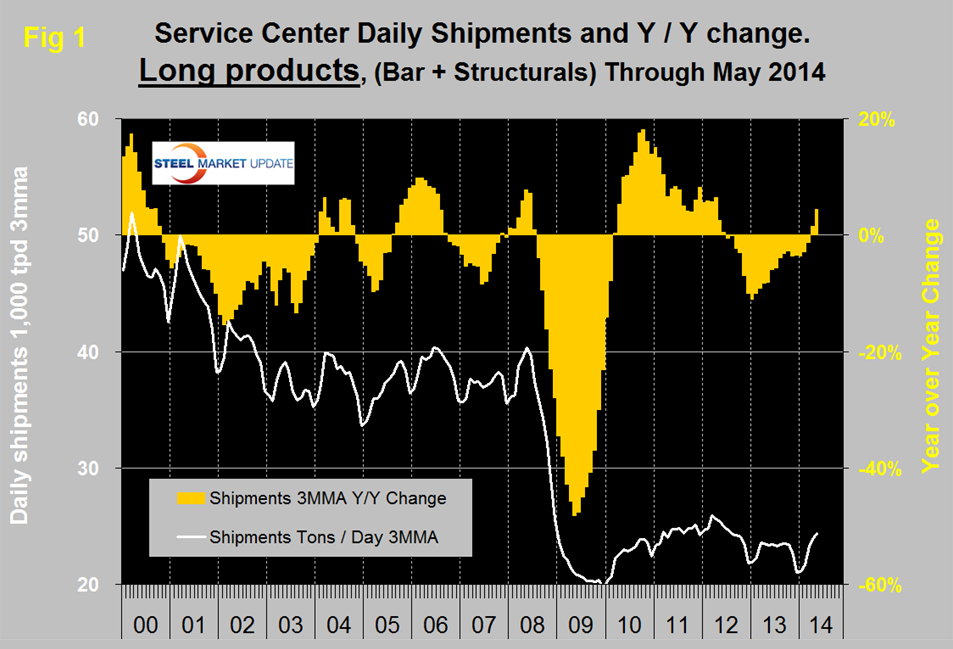
There is a wide difference between the performance of flat rolled, (sheet + plate) and long products, (structurals + bar) at the service center level. Long products have had a very poor recovery from the recession and on a 3MMA basis y/y, April and May were the first months of positive growth after 21 straight months of decline, (Figure 1).
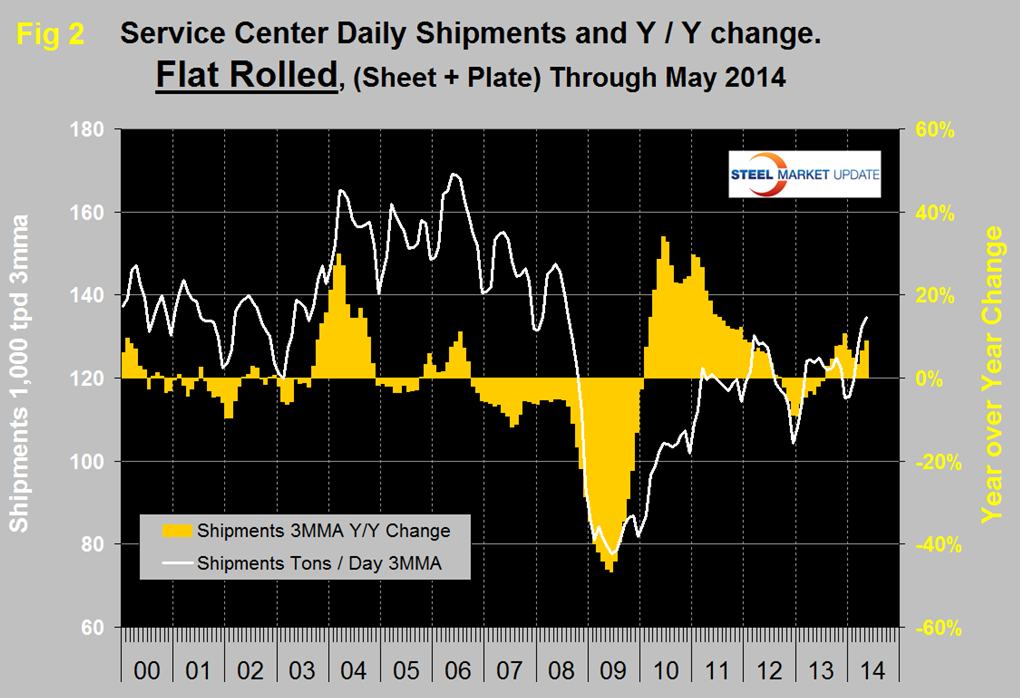
Flat rolled has had a much better recovery since mid-2009 and has had positive y/y growth in each of the last ten months, (Figure 2).
In 2006 and 2007, the mills and service centers were operating at maximum capacity. Figure 3 takes the shipments by product since that time frame and indexes them to the average for 2006 and 2007 in order to measure the extent to which service center shipments of each product have recovered.
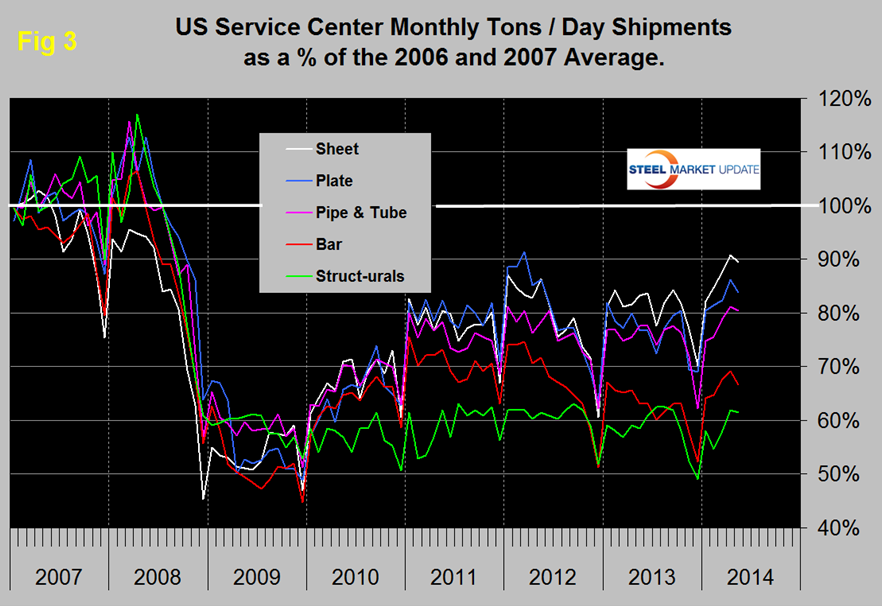
Again it can be seen that sheet and plate have fared best, bar and structurals the worst and tubulars in between. Sheet has had the best recovery and in April exceeded 90 percent of the 2006 /2007 average for the first time since the recession, this declined slightly to 89.5 percent in May. Structurals are still only at 61.4 percent of where they were and the total of all carbon products is still only at 80.4 percent of the 2006 / 2007 average therefore is down by 19.6 percent. The recovery of the service center sector has been much slower than has been experienced by the mills. Presumably this is because in a relatively lack luster market, more buyers are by-passing service centers and buying mill direct and this is probably particularly true of long products. In addition long products being more construction oriented are suffering from prevailing conditions in that business sector.
MSCI uses product nomenclature flat and plate. In our analysis at SMU we replace the term flat with sheet. By our interpretation of the MSCI’s data our definition of sheet is all hot rolled, cold rolled and coated products. Since most of our readers are sheet oriented we have removed plate from Figure 3 to highlight the history of sheet products which are shown in (Figure 4). Positive year over year growth has occurred in each of the last eleven months following nine consecutive months of decline.
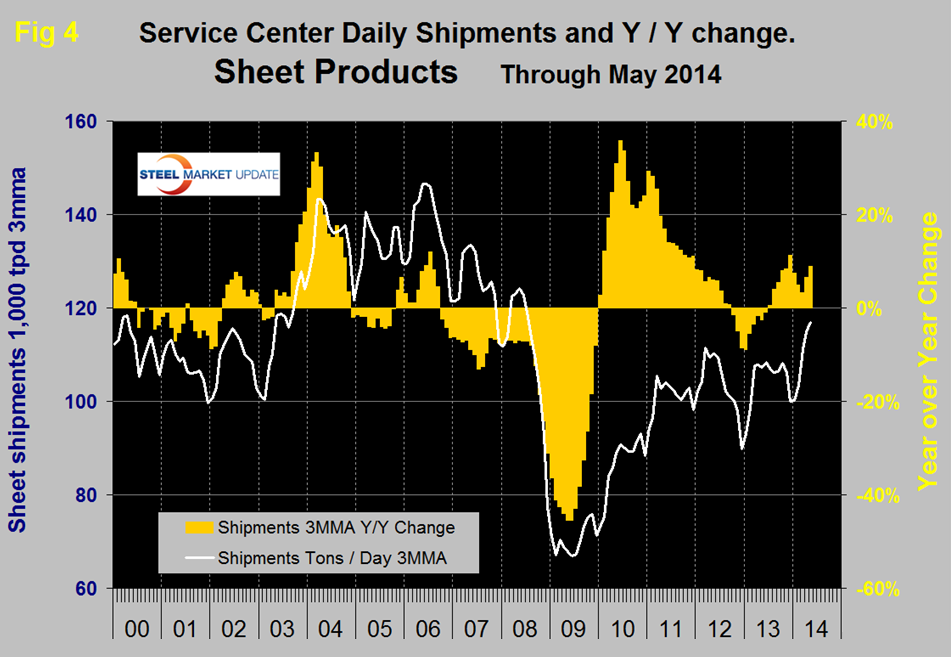
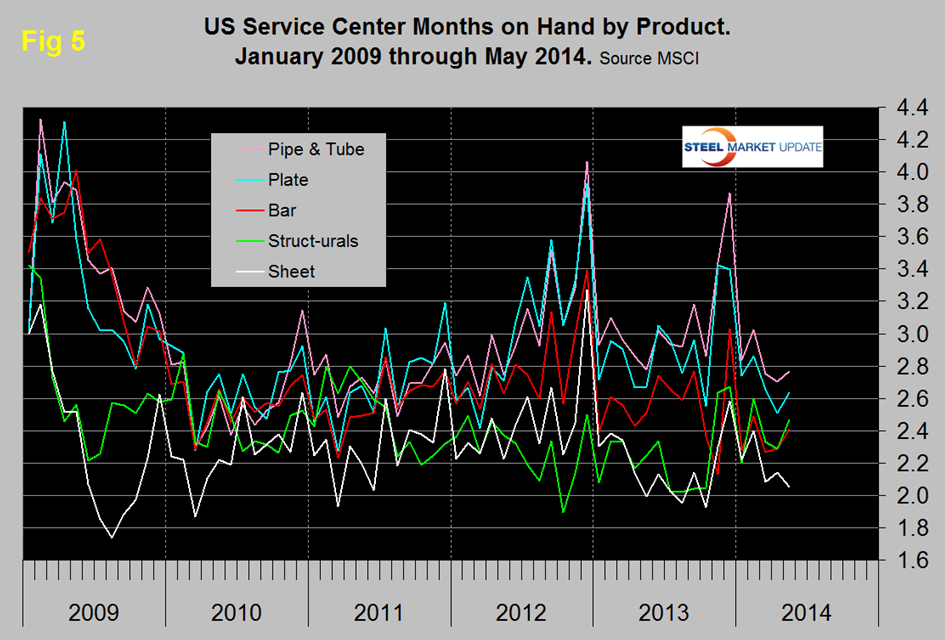
Figure 5 shows the change of inventory at service centers since 2009 measured as months on hand. All products except sheet experienced an increase in months on hand at the end of May. Sheet products constitute by far the largest segment of service center’s business and they have had the best inventory management since 2009 and currently have the lowest months on hand.