

Market Data
June 25, 2014
The Chicago Federal Reserve National Activity Index and Steel Supply
Written by Peter Wright
The following is an abridged version of the Chicago Federal Reserve statement plus our own graphical analysis. The Chicago Federal Reserve National Activity Index (CFNAI) is an excellent reality check for much of the economic analysis that we routinely provide in The Steel Market Update. An explanation of the Index is provided at the end of this piece.
The official statement reads as follows: Led by improvements in production-related indicators, the Chicago Fed National Activity Index (CFNAI) increased to +0.21 in May from –0.15 in April. Three of the four broad categories of indicators that make up the index made positive contributions to the index in May, and three of the four categories increased from April.
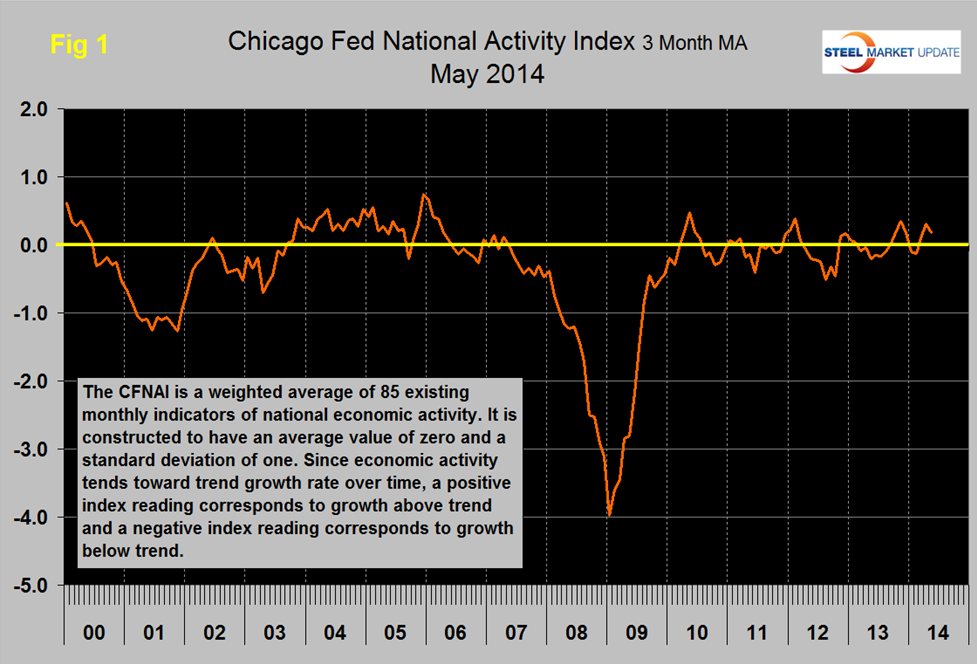
The index’s three-month moving average, CFNAI-MA3, decreased to +0.18 in May from +0.31 in April, marking its third consecutive reading above zero, (Figure 1). May’s CFNAI-MA3 suggests that growth in national economic activity was somewhat above its historical trend. The economic growth reflected in this level of the CFNAI-MA3 suggests limited inflationary pressure from economic activity over the coming year.
The CFNAI Diffusion Index, which is also a three-month moving average, increased to +0.23 in
May from +0.20 in April. Fifty-two of the 85 individual indicators made positive contributions to the CFNAI in May, while 33 made negative contributions. Fifty-five indicators improved from April to May, while 29 indicators deteriorated and one was unchanged. Of the indicators that improved, 17 made negative contributions.
Production-related indicators contributed +0.20 to the CFNAI in May, up from –0.23 in April. Manufacturing production increased 0.6 percent in May after decreasing 0.1 percent in April, and manufacturing capacity utilization rose to 77.0 percent in May from 76.7 percent in the previous month, (Figure 2).
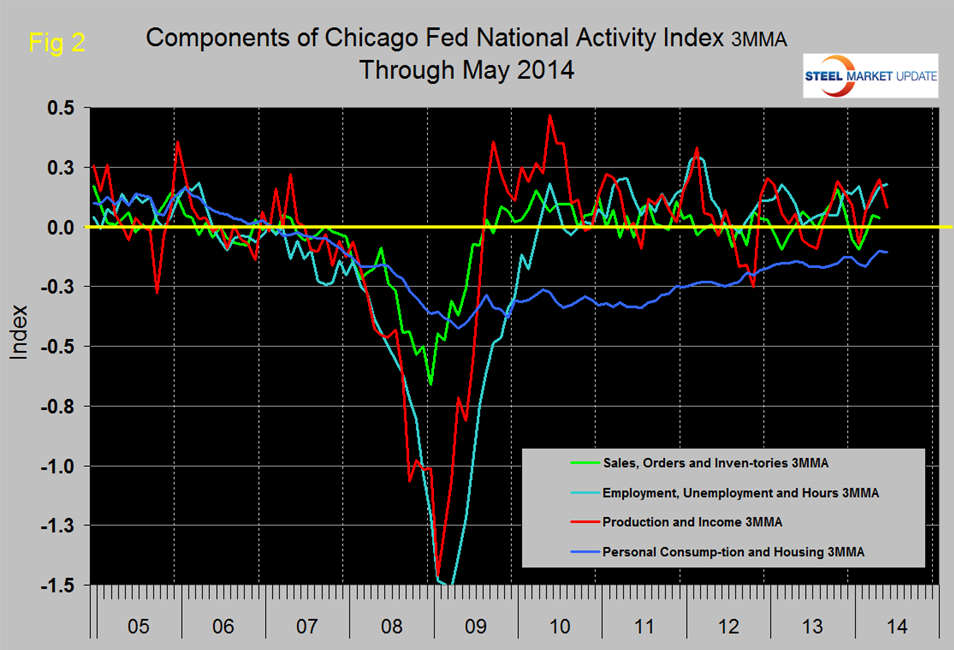
Employment-related indicators contributed +0.10 to the CFNAI in May, down from +0.26 in April. The unemployment rate remained at 6.3 percent in May after declining by 0.4 percentage points in April; and nonfarm payrolls increased by 217,000 in May after rising by 282,000 in the previous month.
The sales, orders, and inventories category contributed +0.04 to the CFNAI in May, up from –0.03 in April. Indicators, on balance, improved, pushing the category’s contribution higher. However, housing starts decreased to 1,001,000 annualized units in May from 1,071,000 in April, and housing permits decreased to 991,000 annualized units in May from 1,059,000 in the previous month.
The contribution from the consumption and housing category to the CFNAI moved up to –0.12 in May from –0.15 in April.
The CFNAI was constructed using data available as of June 16, 2014.
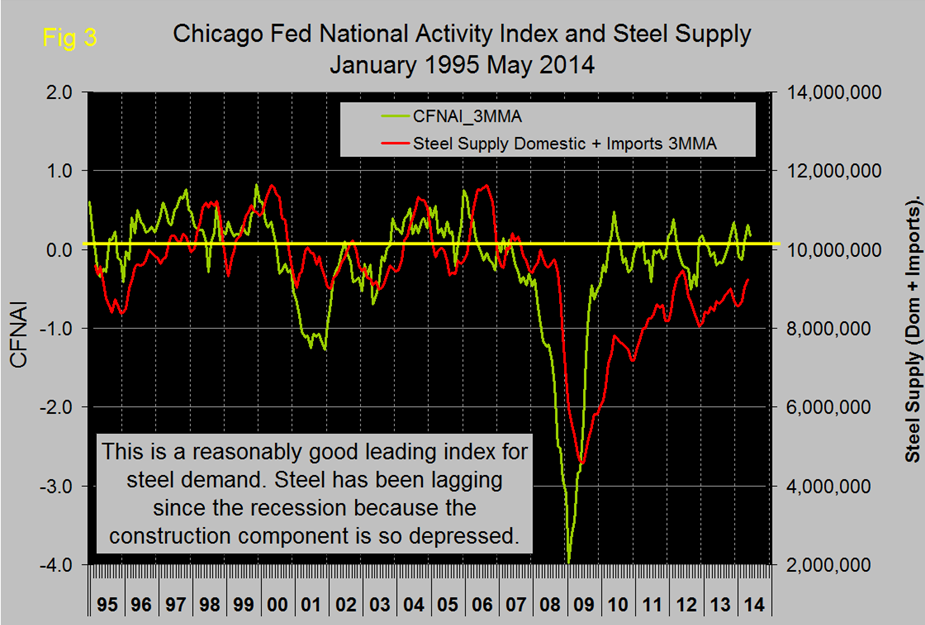
Figure 3 shows that the CFNAI has historically been a reasonably accurate leading indicator of steel demand, (apparent supply) with a lead time of about six months. This is one of several benchmark indicator that shows steel demand has not recovered to its traditional level since the recession. We believe this to be a measure of the extent to which construction, (or lack there-of) is still a drag on steel demand.
Explanation: the index is a weighted average of 85 indicators of national economic activity drawn from four broad categories of data: 1) production and income; 2) employment, unemployment, and hours; 3) personal consumption and housing; and 4) sales, orders, and inventories. A zero value for the index indicates that the national economy is expanding at its historical trend rate of growth; negative values indicate below-average growth; and positive values indicate above-average growth. When the CFNAI-MA3, (three month moving average) value moves below –0.70 following a period of economic expansion, there is an increasing likelihood that a recession has begun. Conversely, when the CFNAI-MA3 value moves above –0.70 following a period of economic contraction, there is an increasing likelihood that a recession has ended. When the CFNAI-MA3 value moves above /+0.70 more than two years into an economic expansion, there is an increasing likelihood that a period of sustained increasing inflation has begun.


