

Market Data
July 18, 2014
Industrial Production and Manufacturing Capacity Utilization in June 2014
Written by Peter Wright
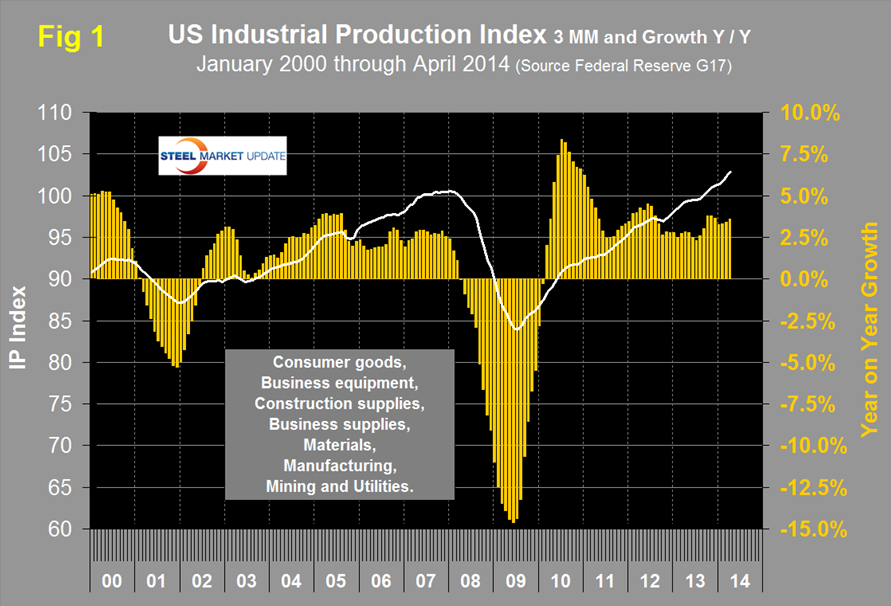
Both these data points are reported in the Federal Reserve G17 data base. The IP index was reported as 103.92 for June, with a three month moving average (3MMA) of 103.6. This was the ninth consecutive month for the index to exceed the pre-recession peak of September 2007. The 3MMA has expanded for 20 straight months and is up by 4.2 year over year. Data is seasonally adjusted. This index is based on the July 2007 level being defined as 100, (Figure 1).
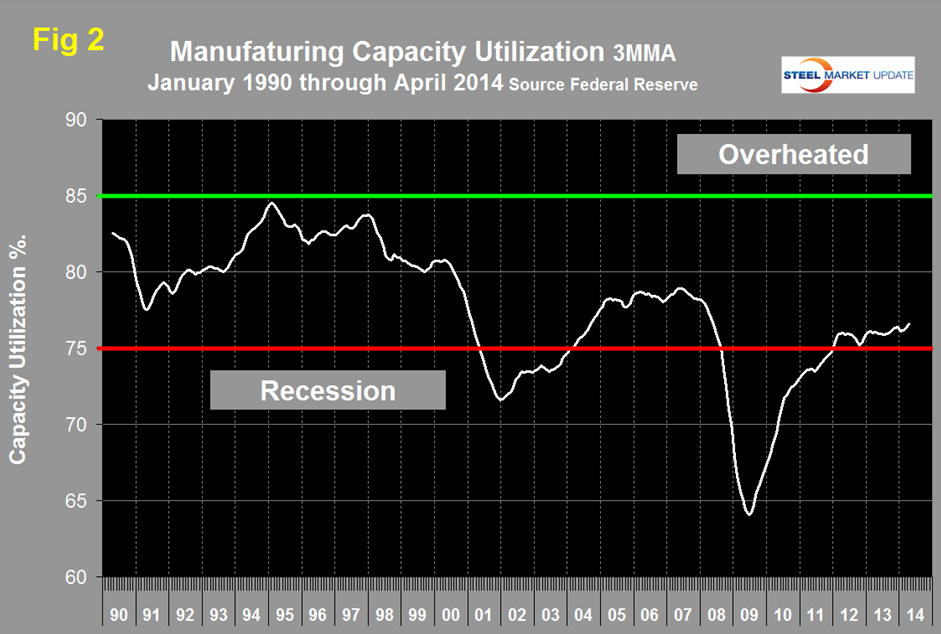
Manufacturing capacity utilization was 77.13 percent in June with a 3MMA of 77.08 percent, up slightly from 76.99 in May and now has a string of four months of improvement, (Figure 2). The 3MMA is now the highest since May 2008.
Moody’s reported as follows in Economy.com: “Manufacturing came back strong in the second quarter, rebounding from an inventory correction and unusually harsh winter that held down production at the start of the year. Manufacturing production grew close to 7 percent at an annual rate in the second quarter, the largest increase since early 2012. Stronger final demand, a positive turn in the inventory cycle, and generally upbeat manufacturing surveys suggest that the modest loss of momentum in manufacturing toward the end of the second quarter should prove temporary. The regional manufacturing surveys for early July point to strong growth this month, and the leading indicators of new orders and finished goods inventory hint at positive momentum that is consistent with the projected acceleration in final demand and inventory investment. Auto production paused but is scheduled to rise rapidly in the third quarter, giving a big boost to broader manufacturing. Domestic energy development, which is boosting the production of mining industries, is also set to continue. Trade flows are also picking up, suggesting more support from overseas, and business equipment spending looks better.”
![]() The Federal Reserve Beige Book released on June 16th reported as follows: “Manufacturing activity expanded further in all twelve Districts since the previous survey period, with growth occurring across many subsectors. Manufacturing activity in the New York, Atlanta, Chicago, Minneapolis, and San Francisco Districts grew at a robust pace, while the manufacturing sectors in the Boston, Philadelphia, Cleveland, Richmond, St. Louis, Kansas City, and Dallas Districts increased at a more modest pace. Compared with the previous report, the pace of growth slowed slightly in the Boston, St. Louis, and Kansas City Districts, and increased in the Richmond District. Contacts in the Chicago, St. Louis, Minneapolis, Dallas, and San Francisco Districts reported generally positive activity within the metals sector. Philadelphia and Chicago noted improved growth in the aerospace industry since the previous survey period. Manufacturing in the auto industry generally strengthened, with Philadelphia, Cleveland, Richmond, Chicago, St. Louis, and San Francisco reporting increased activity; however, Minneapolis noted a moderation in the auto industry’s demand for certain inputs. Manufacturers supporting the energy sector in the Midwest and Northern Appalachia reported stronger sales, specifically for metal-piping related products. Production of construction inputs was mixed, as Kansas City and San Francisco reported a decrease in production and Philadelphia, Chicago, and Dallas reported a slight increase. Boston, Cleveland, Atlanta, Kansas City, and Dallas were optimistic about the near-term outlook for overall manufacturing activity.”
The Federal Reserve Beige Book released on June 16th reported as follows: “Manufacturing activity expanded further in all twelve Districts since the previous survey period, with growth occurring across many subsectors. Manufacturing activity in the New York, Atlanta, Chicago, Minneapolis, and San Francisco Districts grew at a robust pace, while the manufacturing sectors in the Boston, Philadelphia, Cleveland, Richmond, St. Louis, Kansas City, and Dallas Districts increased at a more modest pace. Compared with the previous report, the pace of growth slowed slightly in the Boston, St. Louis, and Kansas City Districts, and increased in the Richmond District. Contacts in the Chicago, St. Louis, Minneapolis, Dallas, and San Francisco Districts reported generally positive activity within the metals sector. Philadelphia and Chicago noted improved growth in the aerospace industry since the previous survey period. Manufacturing in the auto industry generally strengthened, with Philadelphia, Cleveland, Richmond, Chicago, St. Louis, and San Francisco reporting increased activity; however, Minneapolis noted a moderation in the auto industry’s demand for certain inputs. Manufacturers supporting the energy sector in the Midwest and Northern Appalachia reported stronger sales, specifically for metal-piping related products. Production of construction inputs was mixed, as Kansas City and San Francisco reported a decrease in production and Philadelphia, Chicago, and Dallas reported a slight increase. Boston, Cleveland, Atlanta, Kansas City, and Dallas were optimistic about the near-term outlook for overall manufacturing activity.”
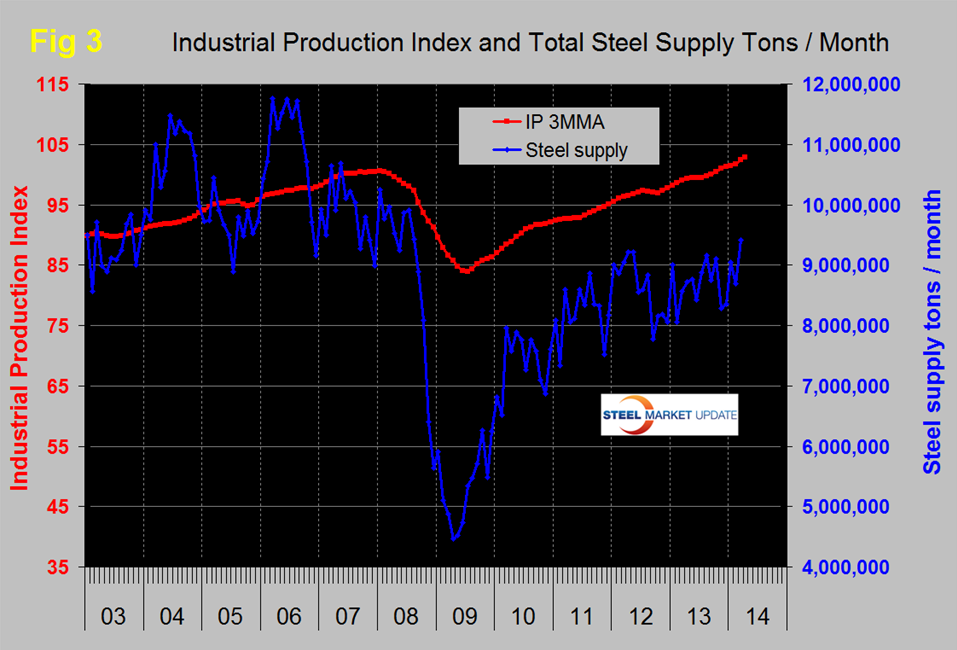
SMU Comment: Prior to the recession there was a reasonable correlation between industrial production and steel supply though steel was very much more volatile in this comparison just as it is against GDP, (Figure 3). We have many indicators that suggest that steel supply is lower than it should be at this stage of a recovery but there has been a recent surge in steel supply which we attribute to manufacturing but more especially to the recent acceleration in construction expenditures reported by the Commerce Department. The Beige book had this to say about residential and commercial construction. “Residential construction activity generally increased across the Districts, with only St. Louis and Minneapolis reporting a decline in overall activity. Chicago and San Francisco reported increased construction of high-end urban single-family homes, and Cleveland and Kansas City continued to see growth in low- to medium-priced single-family construction. Cleveland and San Francisco reported that a shortage of vacant lots was holding back further growth in both single-family and multifamily construction; however, growth remained positive. New York, Richmond, Atlanta, Chicago, Minneapolis, and San Francisco noted that multifamily construction activity increased since the previous survey period. Contacts in the Cleveland District reported that they were seeing greater willingness to finance multifamily projects.
Commercial construction activity strengthened across most Districts. Cleveland and Atlanta reported increased commercial construction activity compared to a year ago, and Philadelphia, Chicago, St. Louis, Minneapolis, Kansas City, Dallas, and San Francisco noted gains since the previous survey period. Boston and Richmond saw mixed commercial construction activity across their Districts since the previous report. Dallas indicated strong overall commercial real estate construction activity, and commercial real estate construction increased in the Minneapolis District compared with the previous report. Boston, New York, Richmond, Chicago, Kansas City, and Dallas reported tight commercial vacancy rates. Industrial real estate construction and leasing activity was strong in the Philadelphia and Chicago Districts.”


