Prices
July 20, 2014
China Steel Production Exceeds 50% of Global Total in June
Written by Peter Wright
Steel production in June on a tons per day basis was 4.571 million metric tons. The last four months have all been greater than 4.5 million metric tons per day for the first time ever. The three month moving average (3MMA) of production in June on an annualized basis was 1.658 billion metric tons and the steel mill capacity utilization rate of 78.6 percent, (Figure 1). Capacity is now 2.076 billion metric tons.
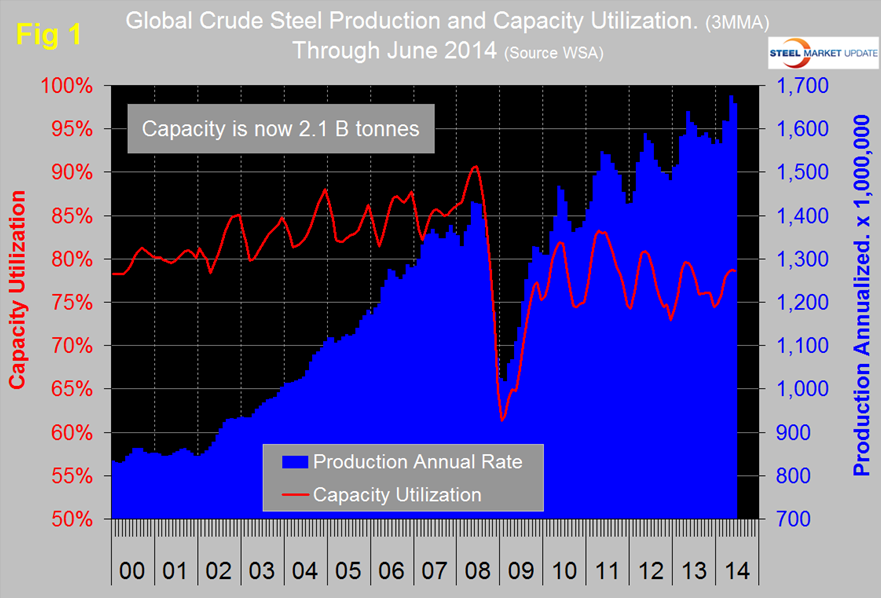
Table 1 shows regional production in the single month of June with regional share of the global total, also three months production through June and YTD production. This month we have expanded Table 1 from previous publications to include the top 10 steel producing nations. Regions are shown in white font and individual nations in beige. In three months through June year over year global growth was 2.6 percent. Year to date was 2.5 percent indicating that growth accelerated slightly in the 2nd quarter. All regions except other Europe and South America had positive year over year growth in the three months through June.
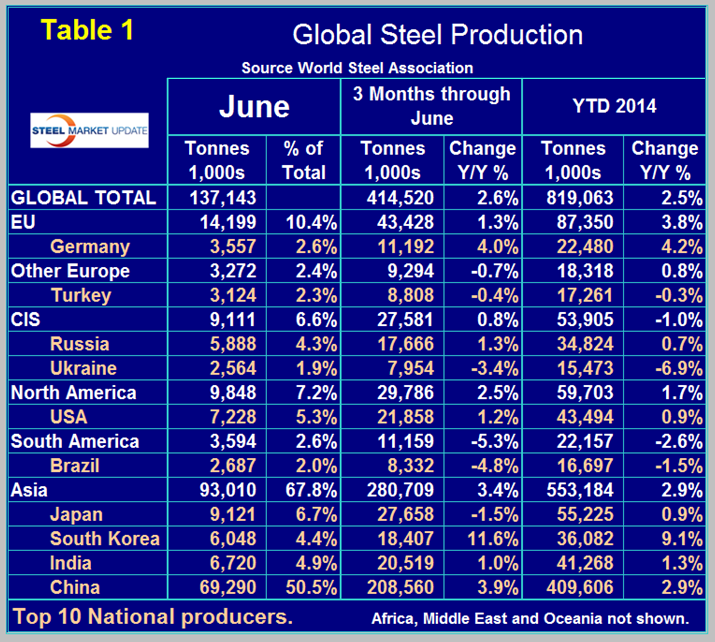
The European Union which had the fastest growth rate in recent months slowed to 1.3 percent in three months through June led by Germany with a 4.0 percent growth rate. Growth of output in the NAFTA was 2.5 percent in three months through June with the US lagging at 1.2 percent.
South America slowed by 5.3 percent in three months through June year over year with its largest producer, Brazil down by 4.8 percent. Growth in Asian production was 3.4 percent led by South Korea at 11.6 percent.
In the single month of June, China’s production grew by 7.9 percent compared to June last year. This pushed the three month growth rate up to 3.9 percent and total production to once again exceed 50 percent of the global total. The latest Chinese numbers are a reversal of the much reported policy of growth curtailment.
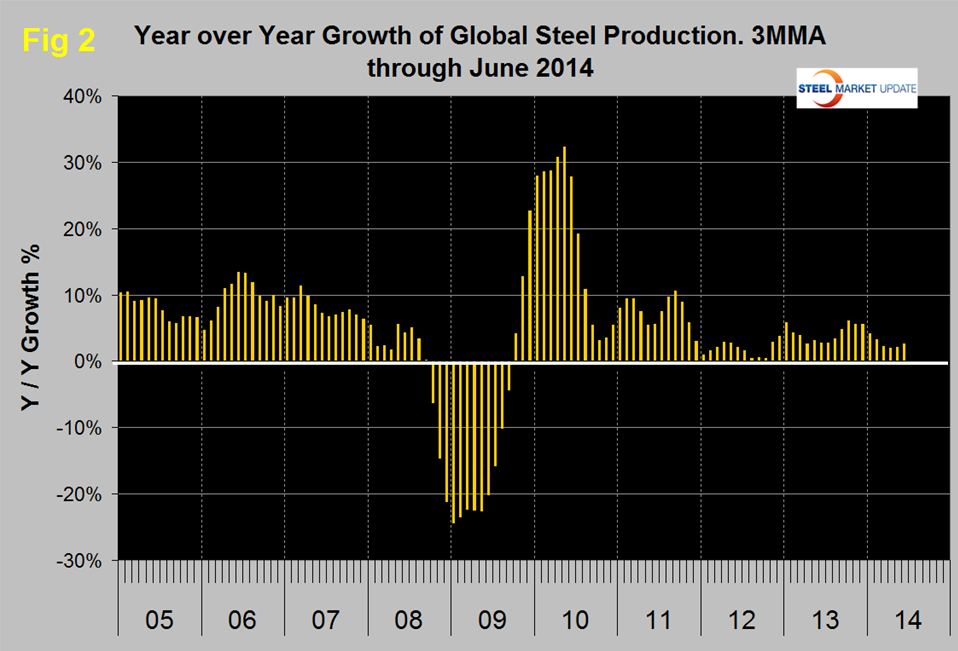
North America and China produced 7.2 percent and 50.5 percent of the global total in June respectively. Figure 2 shows the year over year growth of global production which picked up in June after slowing in Q1 2014. (Source: World Steel Association)