Analysis
August 4, 2014
Construction Put in Place (CPIP)
Written by Peter Wright
Each month the Commerce Department issues its Construction Put in Place (CPIP) data on the first working day covering activity two months earlier. June data was released on August 1st. Construction put in place is based on spending work as it occurs, estimated for a given month from a sample of projects. In effect the value of a project is spread out from the project’s start to its completion.
Total Construction: Data is reported on both a seasonally adjusted and non-adjusted basis. In the SMU analysis we consider only the non-seasonally adjusted data and remove seasonality by the consideration of year over year (y/y) data. We also focus on rolling 3 and 12 months to remove the noise in single month numbers. Please note that the official news release from the Commerce Department appears at first glance to conflict with this SMU analysis because the government comments on seasonally adjusted numbers.
June expenditures were $85.502 billion which breaks down to $60.673 B of private work, and $22.825 B of state and locally, (S&L) funded work and $2.004 B of federally funded, (Table 1).
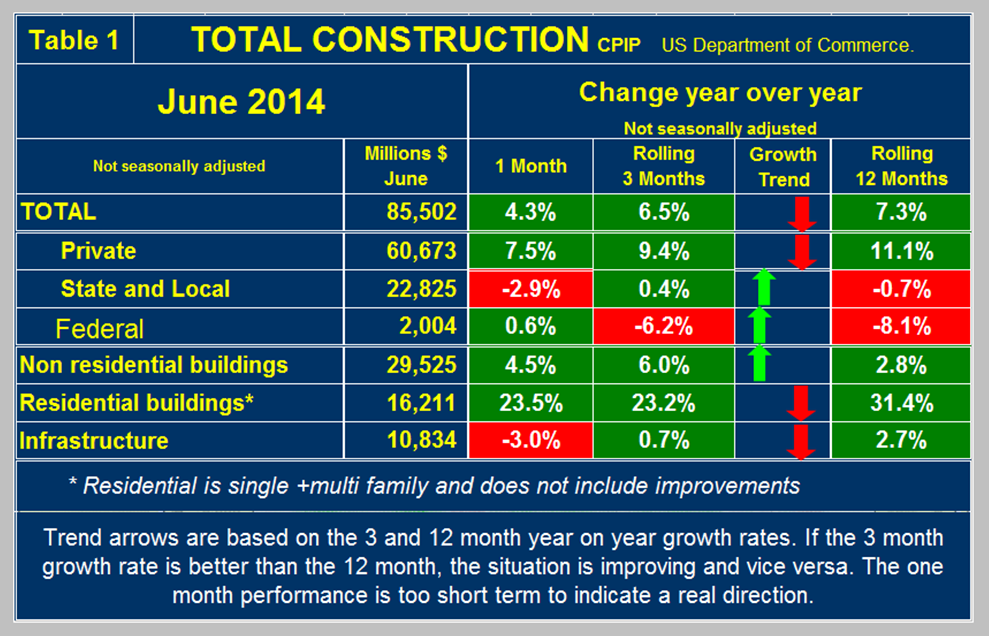
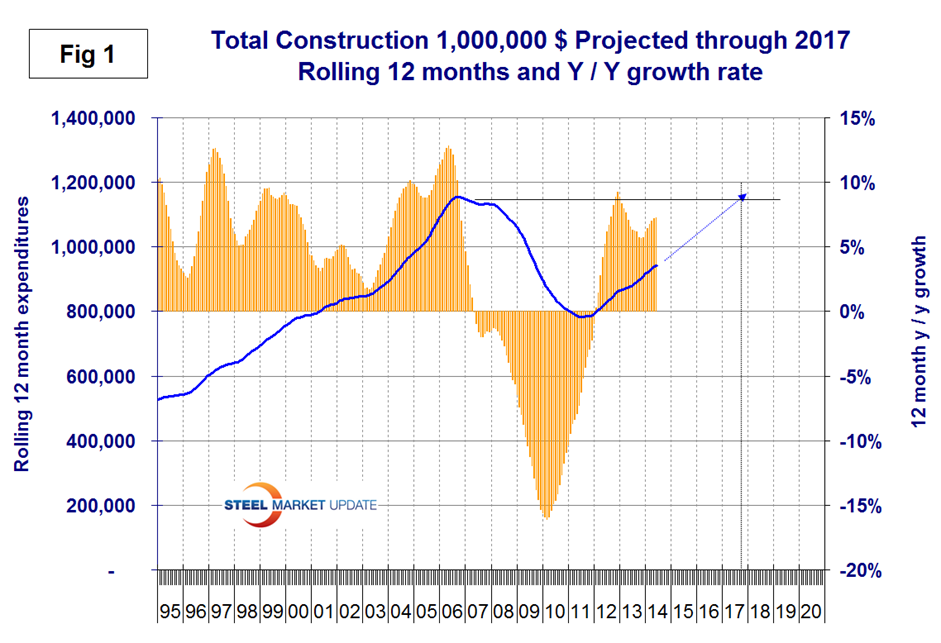
On a rolling three month basis total construction was up by 6.5 percent y/y and was up by 7.3 percent on a rolling 12 months y/y. This means that total construction growth is decelerating slightly since the short term growth (3 months) is less than the long term, (12 months). Note this is not a seasonal effect because our y/y analysis removes seasonality. Private work has negative momentum but state and local momentum was positive in the June results. We consider three sectors within total construction. These are non-residential, residential and infrastructure. On a rolling three month basis y/y non-residential is growing at 6.0 percent and accelerating. Residential is growing at 23.2 percent and slowing. Infrastructure grew 0.7 percent y/y and decelerated in the last three months compared to the rolling 12 month number. This was probably due to shenanigans on the Hill, see below. The growth of total construction has been fairly steady for over 18 months but it will be Q3 2017 before the pre recessionary peak is regained, (Figure 1). The pre-recession peak of total construction on a rolling 12 month basis was $1,145 B in 12 months through February 2007. The low point was $768 B in 12 months through May 2011. The 12 month total through the latest data of June 2014 was $943 B. This means that total construction is still only 82.3 percent of its pre-recession peak.
Private Construction: Private work decelerated slightly from an 11.1 percent growth rate in 12 months y/y to a 9.4 percent rate in 3 months y/y, (Table 2).
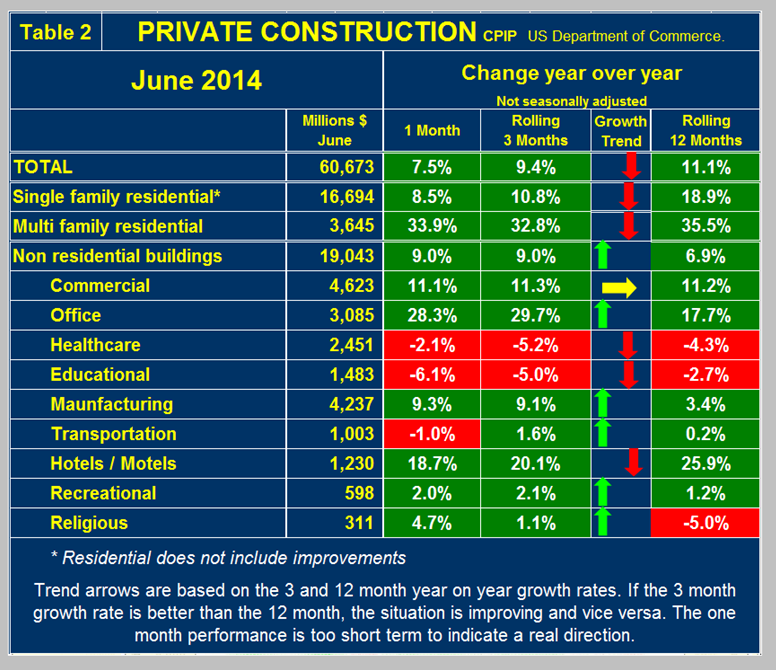
On a rolling 12 month basis the growth of private work has exceeded 10 percent for the last 22 months but at the current rate it will be mid 2017 before recovery is complete, (Figure 2).
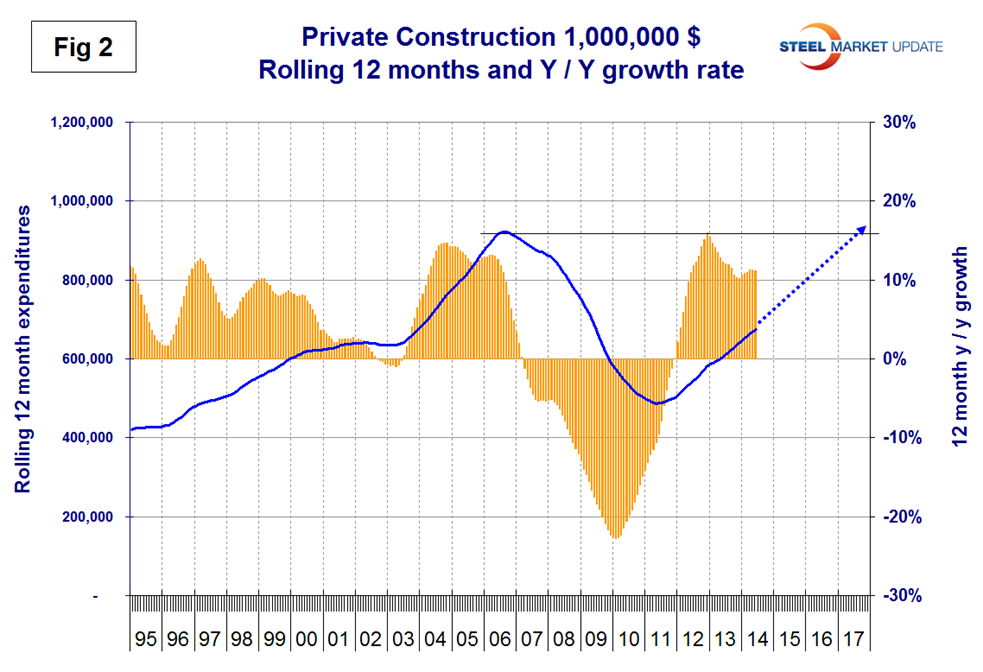
Table 2 breaks down the private sector into project types. Residential buildings, both single and multi-family still have strong y/y growth but are slowing. Particularly single family. This data coincides well with the housing starts data that SMU reports every month. Private non-residential buildings grew at a 9.0 percent rate in three months through June y/y with a positive momentum. Within private non-residential, only health care and educational are showing a sustained contraction. Offices and hotels / motels continue to show surprising strength with offices accelerating and accommodation slowing.
State and local Construction: S&L work contracted by 2.9 percent in the single month of June y/y and eked out a small gain of 0.4 percent in the rolling three months through June, (Table 3).
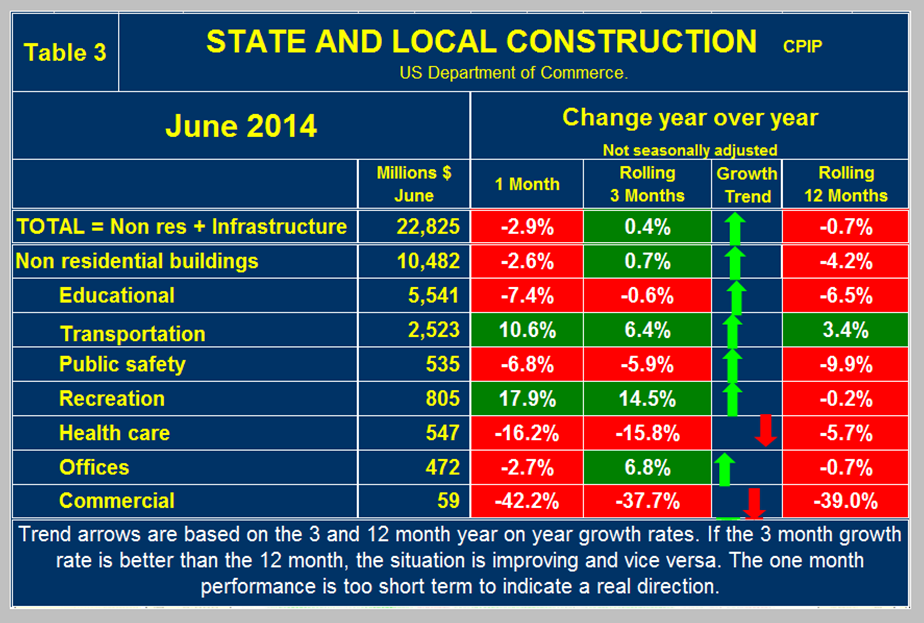
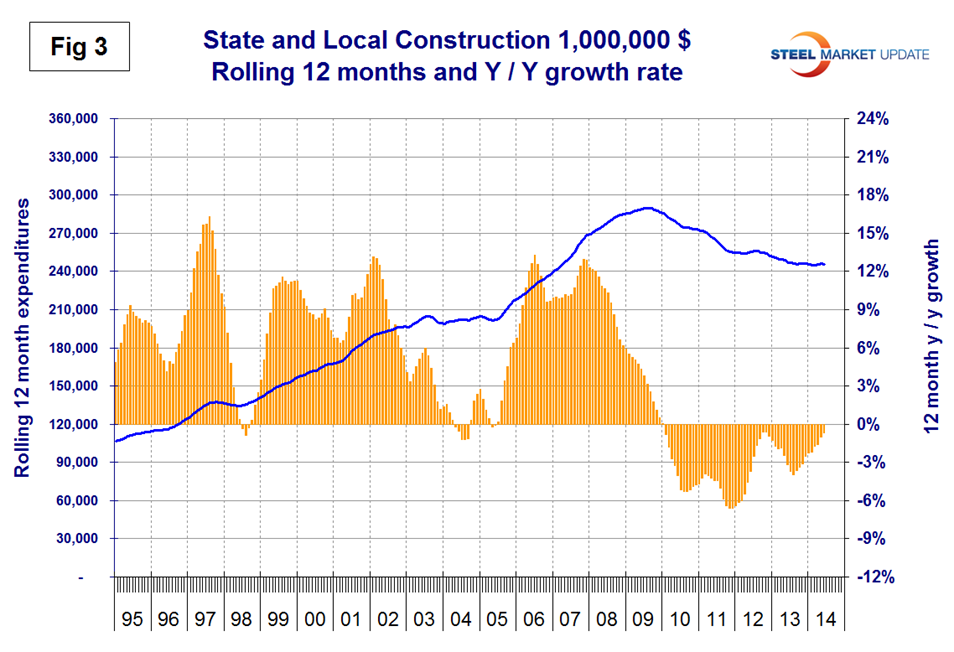
Overall state and local construction expenditures on a rolling 12 month basis appear to have bottomed out, (Figure 3). S&L non-residential building grew by 0.7 percent in three months through June y/y which was a turnaround from the 4.2 percent contraction in 12 months y/y. Educational buildings are about 75 percent funded by state and local governments and are by far the largest sub sector of S&L non-residential at almost $5.5 billion in June. Transportation terminals continue to do well and recreational spending has surged in the last two months. State fiscal balances are improving as income and sales tax revenues recover and property values / taxes increase. However many state and local governments are far from healthy, as increased revenues have been more than offset by increased future obligations, including the need to replenish reserve and rainy-day funds and to service defined benefit liabilities, pensions and Medicaid foremost. Therefore, there is little room for increased public spending on all but the most essential categories. Considering the financial weakness of many sub-national governments, it will be many years before public construction catches up to pre-recession levels.
Drilling down into the private and S&L sectors as presented in Tables 2 and 3 shows which project types should be targeted for steel sales and which should be avoided. There are some project types within S&L that are doing quite well but there are also major regional differences to be considered.
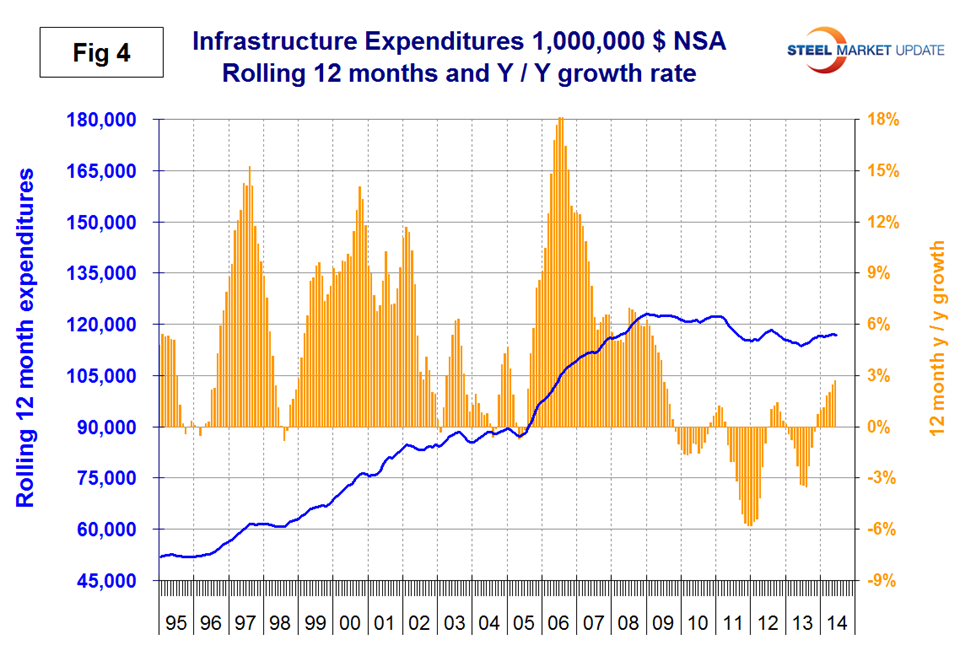
Infrastructure: Expenditures have had positive growth in each of the last ten months through June on a rolling 3 months basis with a + 0.7 percent result in the latest data. The growth in three months is slower than that in 12 months meaning that momentum slowed as the industry waited for the resolution of the highway trust fund issue. Bridge construction is still strong though slowing and is the bright spot in total highways and streets expenditures, (Table 4).
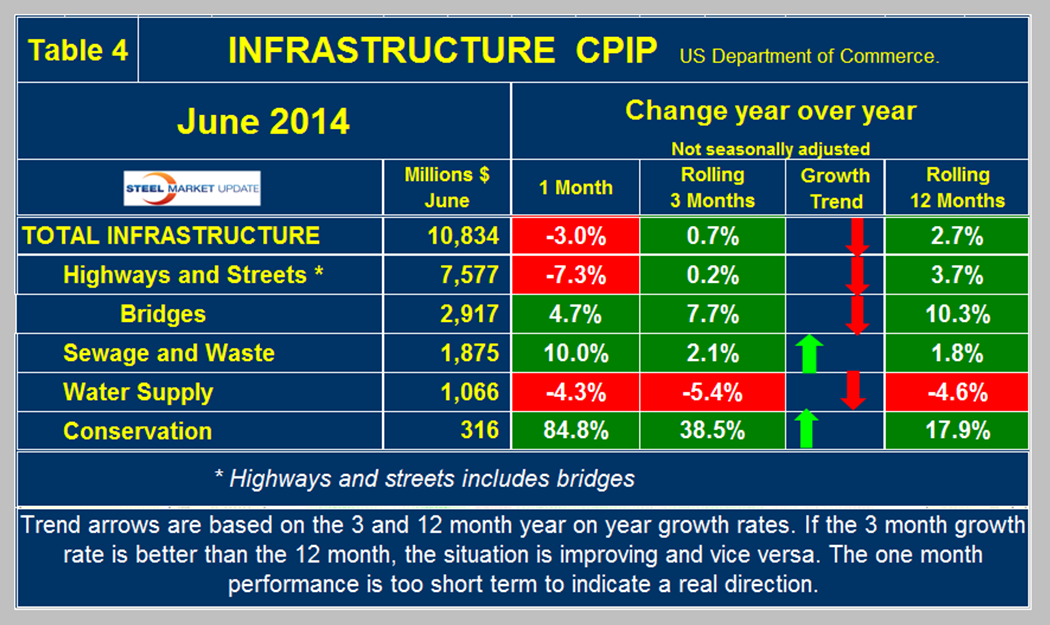
Water supply continued to contract through June with negative momentum. There has been a surge in conservation expenditures this year but the outlays are relatively small. On a rolling 12 month basis, infrastructure expenditures are about where they were two years ago. (Figure 4).
The press release from the Commerce Department on Friday read as follows.
June 2014 Construction AT $950.2 Billion Annual Rate
The U.S. Census Bureau of the Department of Commerce announced today that construction spending during June 2014 was estimated at a seasonally adjusted annual rate of $950.2 billion, 1.8 percent below the revised May estimate of $967.8 billion. The June figure is 5.5 percent above the June 2013 estimate of $900.3 billion.
During the first 6 months of this year, construction spending amounted to $445.1 billion, 7.8 percent above the $413.0 billion for the same period in 2013.
Private Construction
Spending on private construction was at a seasonally adjusted annual rate of $685.5 billion, 1.0 percent below the revised May estimate of $692.0 billion. Residential construction was at a seasonally adjusted annual rate of $355.9 billion in June, 0.3 percent below the revised May estimate of $357.0 billion. Nonresidential construction was at a seasonally adjusted annual rate of $329.5 billion in June, 1.6 percent below the revised May estimate of $335.0 billion.
Public Construction
In June, the estimated seasonally adjusted annual rate of public construction spending was $264.7 billion, 4.0 percent below the revised May estimate of $275.7 billion. Educational construction was at a seasonally adjusted annual rate of $59.7 billion, 4.9 percent below the revised May estimate of $62.8 billion. Highway construction was at a seasonally adjusted annual rate of $75.3 billion, 10.4 percent below the revised May estimate of $84.0 billion.
On Thursday last week at the last minute before congress headed out for their summer recess, a short term compromise to prevent the highway trust fund from going broke in August was achieved.
The HILL Transportation Blog reported on Thursday July 31st:
Senate sends highway bill to Obama. After the House rejected Senate changes, senators held their noses Thursday and voted 81-13 for a $10.9 billion bill to fund highway projects through May 2015. Earlier in the week, the Senate voted to amend the House-passed Highway Trust Fund bill, changing the length of the extension to December to pressure lawmakers to come up with a long-term solution after the midterm elections. Senate Finance Committee Chairman Ron Wyden (D-Ore.) said it would have been “legislative malpractice” for the Senate to simply accept the House version without attempting to put its own stamp on the bill, but in the end, there were enough senators to pass the House bill as is.
“Congress needs to act immediately to prevent a shortfall in the Highway Trust Fund … Thousands of jobs are at stake here,” committee ranking member Orrin Hatch (R-Utah) said ahead of the vote. “The only viable solution is for the Senate to take up the House bill and pass it. … We don’t have any other options if we want to get this done before the recess.”
The bill now heads to President Obama’s desk for his signature. The White House has said it would accept the House legislation but would have preferred a $302 billion four-year extension of highway funding.
Wyden said the House action was clear that it was “our way or no highway.” If the Senate hadn’t acted this week, the Highway Trust Fund would have gone bankrupt during the August recess.
The House’s nine-month extension relies on so-called “pension smoothing” — a proposal that budget experts across the ideological spectrum have dubbed a budget gimmick — and boosting customs user fees to extend highway funding.
But Wyden suggested that less money should be used out of both those policies, and instead use tax revenue to pay for the shortfall, such as increasing tax compliance on home mortgage interest.
Republicans have objected to the Senate approach, arguing Congress should not empower the IRS after its mishandling of applications for tax-exempt groups.
The trust fund gets its money from the 18.4-cents-per-gallon gas tax, which has struggled to keep pace with infrastructure spending. Some lawmakers have proposed raising the gas tax, which hasn’t been increased in more than 20 years, in a six-year funding bill in order to avoid more shortfalls in the future.
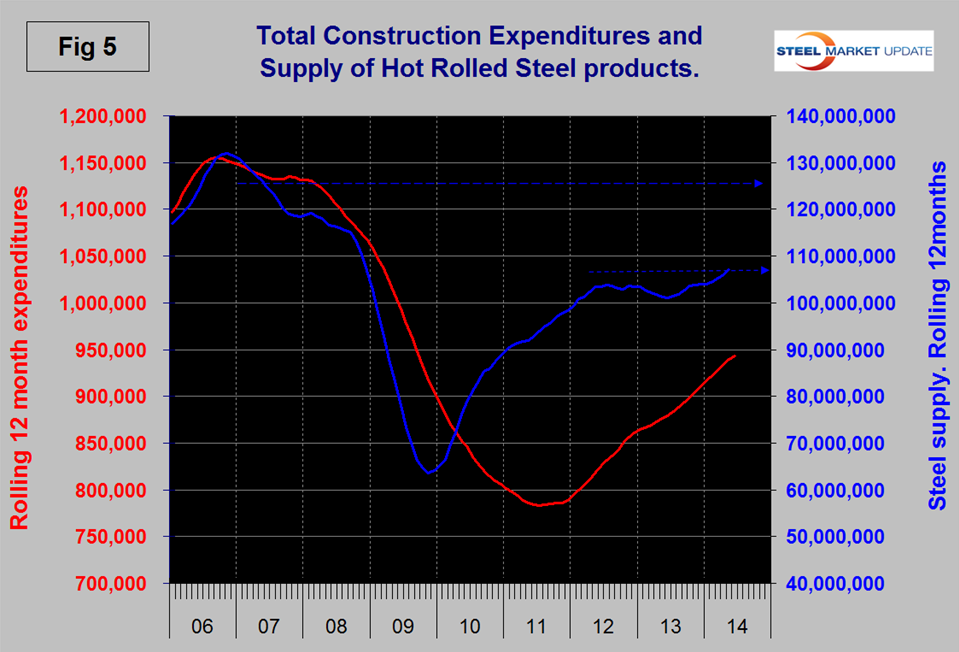
SMU Comment: Steel consumption is about eight million tons per year below where it should be at this stage of recovery from a recession. Manufacturing has pulled its weight but construction is still a drag. Figure 5 illustrates the magnitude of this effect.