Market Data
August 4, 2014
Net Job Creation through July 2014
Written by Peter Wright
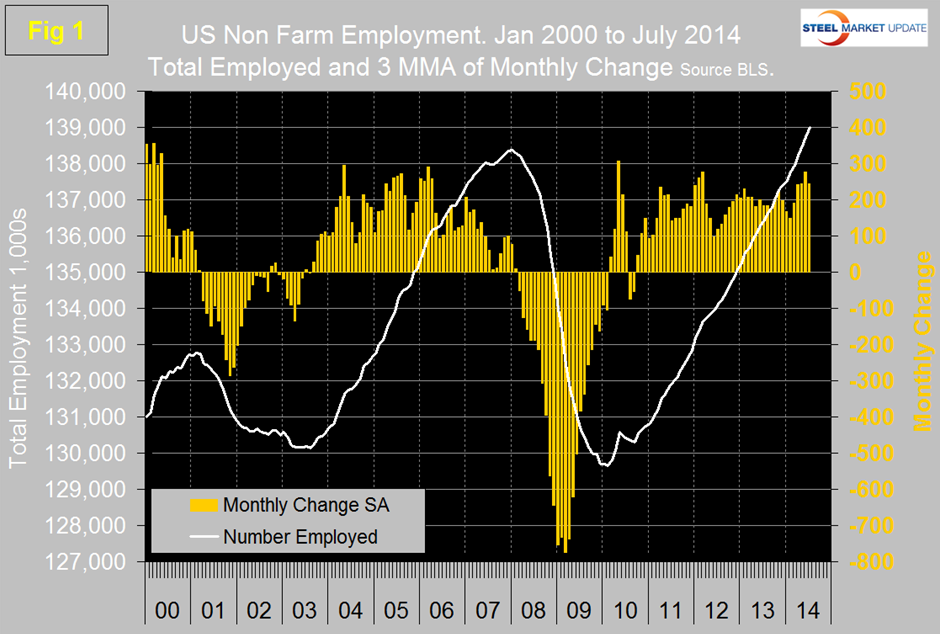
The Bureau of Labor Statistics (BLS) report on non-farm employment indicated that 209,000 jobs were added in July, June was revised up by 10,000 to 298,000 and May up by 5,000 to 229,000. The three month moving average, (3MMA) declined to 245,000 in July after four consecutive months of growth beginning in February at 150,000, (Figure 1).
All numbers in this analysis are seasonally adjusted by the BLS. The total number of people employed in the US is now 139.004 million. The first estimate of GDP growth in the second quarter was released this week with a value of + 3.89 percent. There is an interesting relationship between GDP and job creation which is similar to that between GDP and steel production. In both cases the trend line does not cross at the zero convergence point. As we have reported several times in this publication it takes about a 2.5 percent growth in GDP to get any growth in steel production. Similarly over the long haul it takes almost 2 percent growth in GDP to get any net growth in employment. Figure 2 shows the relationship between job creation and the growth of GDP. The Q2 data for job creation and GDP growth falls exactly on the 44 year trend line.
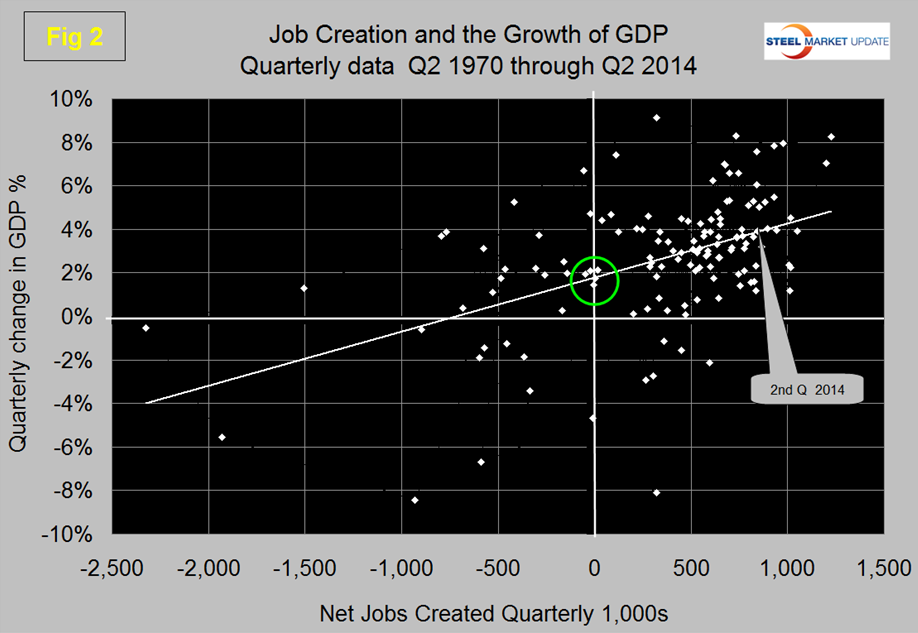
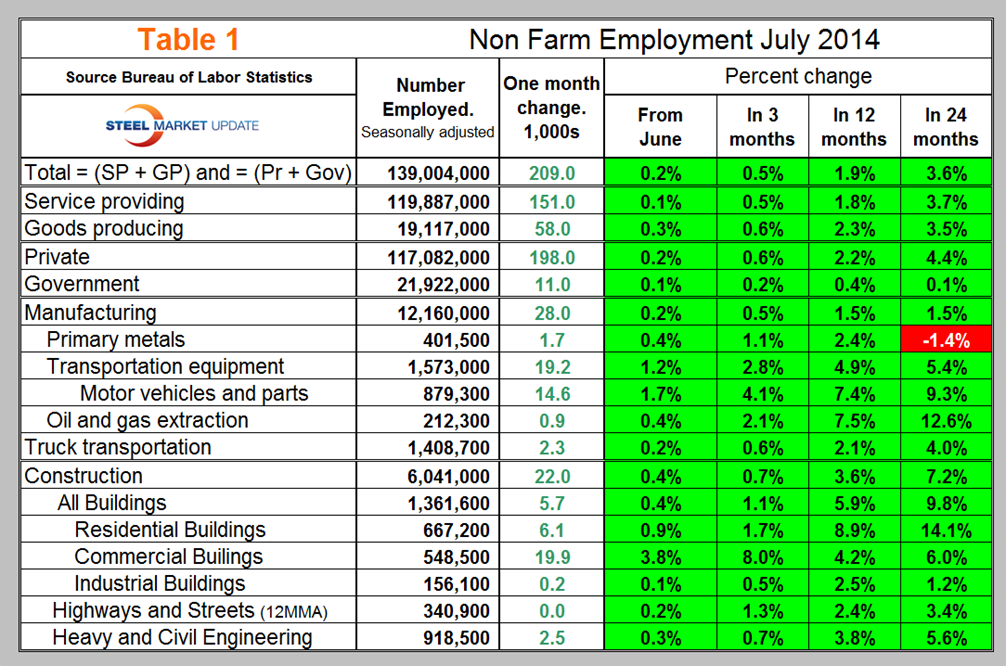
Table 1 slices total employment into service and goods producing industries and then into private and government employees. Total employment equals the sum of private and government employees. It also equals the sum of goods producing and service employees. Most of the goods producing employees work in manufacturing and construction and these sectors are further subdivided in Table 1. In July private employment grew by 198,000 and government by 11,000. Service industries expanded by 151,000 and goods producing by 58,000 people. An encouraging sign in July is that goods producing industries had a growth rate three times that of service industries. Private sector employment has expanded by 4.4 percent in the last 24 months as government has grown by 0.1 percent. Government employment contracted from September 2009 through January this year but has now had six straight months of growth. In the latest six months the federal government has shed 7,000 jobs, state governments have gained 9,000 and local governments have added 88,000 positions.
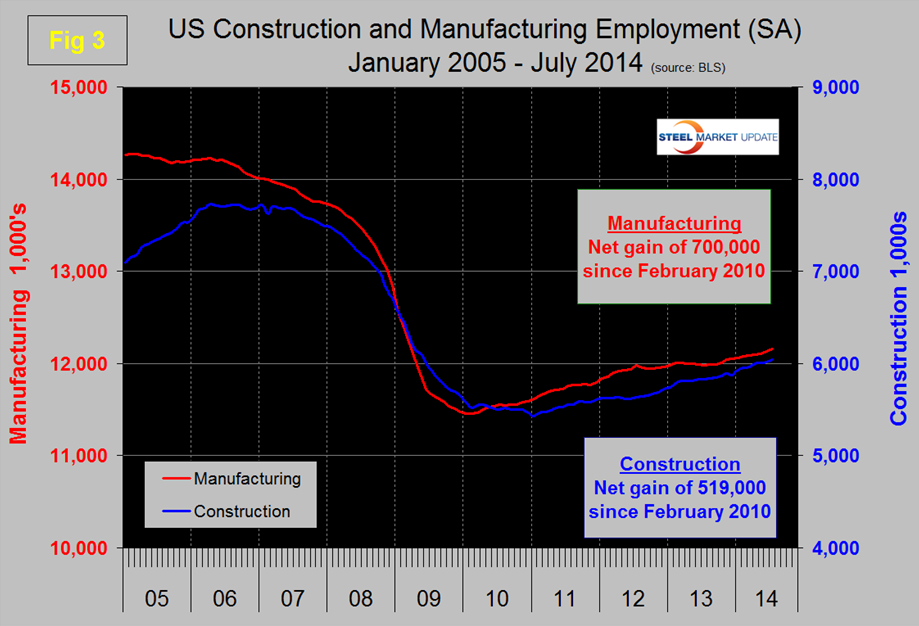
The growth of construction employment outpaced manufacturing for the last 3, 12 and 24 month periods but this turned around in July. Of the net new goods producing jobs gained in July, 22,000 were in construction and 28,000 in manufacturing. Both encouraging for future steel demand. The employment growth rate in primary metals industries was double that of manufacturing as a whole in both July and the three months through July. In the last 24 months construction has added 406,000 jobs as manufacturing has expanded by 181,000, (Figure 3).
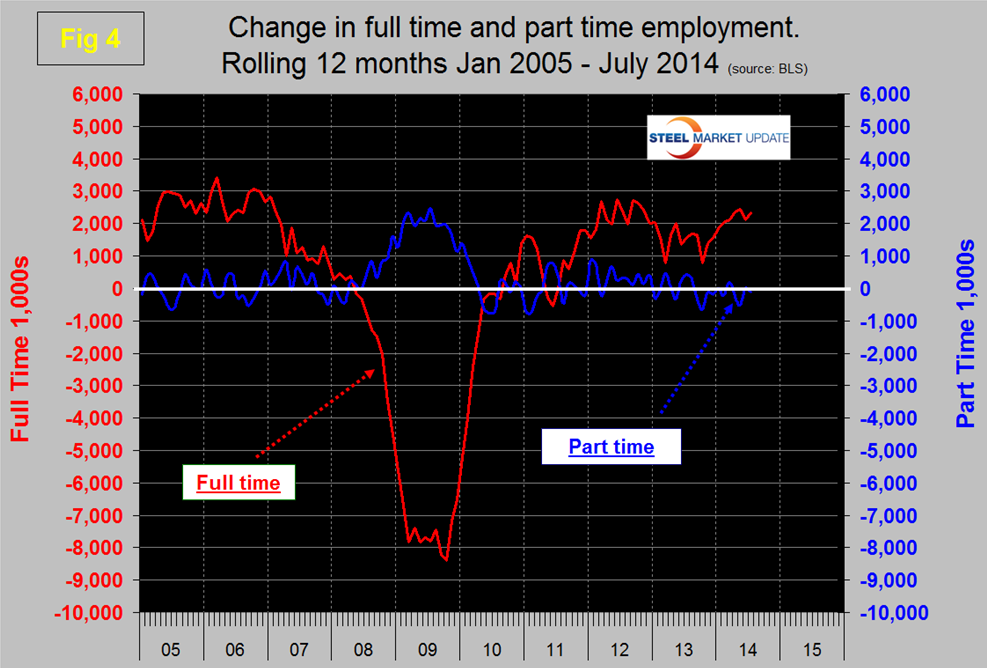
The press frequently reports that most employment growth is part time and in some months that is true but the part time employment statistics are violently erratic ranging from negative 398,000 to positive 799,000 in the seven months of 2014. The only way to make sense of the part time job situation is to examine a 12 month moving average which smooths out most of the variability. Figure 4 shows full time and part time employment growth since January 2005 both on a rolling 12 month basis. Virtually all of the growth in employment since 2010 has been in full time work with almost a net zero increase in part time employment. Part time by this definition is less than 35 hours per week.
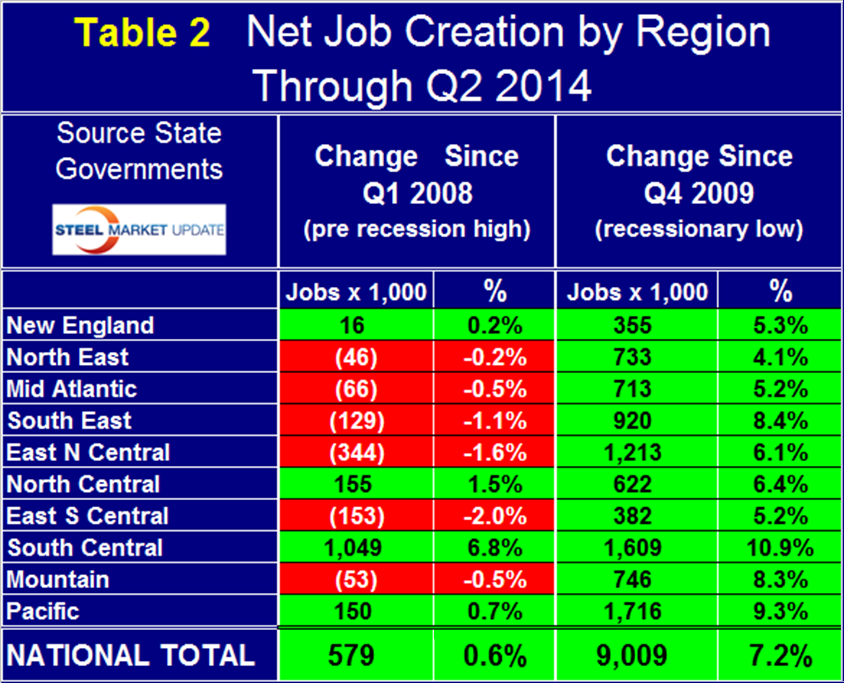
The individual states report job creation independently of the Bureau of Labor Statistics. The national total from both sources is in good agreement. In 30 months, (10 quarters) since Q1 2012 the total jobs created according to the BLS was 5,952,000, according to the sum of all individual state reports was 5,875,200 a difference of only 1.3 percent. However there is an enormous difference between regions in their job creation performance. As we consider how far the nation has progressed since the recession, total employment is one if the key criteria and at the national level 579,000 more people are now employed than there were before the recession. This is not yet a cause for celebration because about seven million people have entered the employable population since 2008. Table 2 shows the net change in employment by region and at the national level since Q1 2008 which was the pre-recession high. At the national level, the increase in employment has been 0.6 percent but regionally this varies from + 6.8 percent to – 1.6 percent. Of nine regions, only four have had a net gain in the number of people employed and only the South Central, (Texas, Louisiana, Arkansas and Oklahoma) can be said to have truly ‘recovered”. The two right hand columns of Table 2 show the number of jobs gained by region since the bottom of the recession which was Q4 2009. Again there is a wide variation between regions ranging from a gain of 4.1 percent in the North East to 10.9 percent in the South Central. Clearly in any discussion of economic recovery it is insufficient to consider employment solely at the national level.
The Bureau of Labor Statistics press release, Friday August 1st read as follows:
Total non-farm payroll employment increased by 209,000 in July, the same as its average monthly gain over the prior 12 months. In July, employment grew in professional and business services, manufacturing, retail trade, and construction. The unemployment rate was little changed at 6.2 percent, the U.S.
Professional and business services added 47,000 jobs in July and has added 648,000 jobs over the past 12 months. In July, employment continued to trend up across much of the industry, including a gain of 9,000 jobs in architectural and engineering services. Employment in temporary help services changed little over the month.
Manufacturing added 28,000 jobs in July. Job gains occurred in motor vehicles and parts (+15,000) and in furniture and related products (+3,000). Over the prior 12 months, manufacturing had added an average of 12,000 jobs per month, primarily in durable goods industries.
In July, retail trade employment rose by 27,000. Employment continued to trend up in automobile dealers, food and beverage stores, and general merchandise stores. Over the past year, retail trade has added 298,000 jobs.
Employment in construction increased by 22,000 in July. Within the industry, employment continued to trend up in residential building and in residential specialty trade contractors. Over the year, construction has added 211,000 jobs.
Social assistance added 18,000 jobs over the month and 110,000 over the year. (The social assistance industry includes child day care and services for the elderly and persons with disabilities.)
Employment in health care changed little over the month, with job gains in ambulatory health care services (+21,000) largely offset by losses in hospitals (-7,000) and nursing care facilities (-6,000).
Mining added 8,000 jobs in July, with the bulk of the increase occurring in support activities for mining (+6,000). Over the year, mining employment has risen by 46,000.
Employment in leisure and hospitality changed little in July but has added 375,000 jobs over the year, primarily in food services and drinking places.
Employment in other major industries, including wholesale trade, transportation and warehousing, information, financial activities, and government, showed little change in July.
In July, the average workweek for all employees on private non-farm payrolls was 34.5 hours for the fifth straight month. The manufacturing workweek decreased by 0.2 hour in July to 40.9 hours, and factory overtime edged down by 0.1 hour to 3.4 hours.
The average workweek for production and non-supervisory employees on private non-farm payrolls was 33.7 hours for the fifth consecutive month.
In July, average hourly earnings for all employees on private non-farm payrolls edged up by 1 cent to $24.45. Over the past 12 months, average hourly earnings have risen by 2.0 percent. In July, average hourly earnings of private-sector production and non-supervisory employees increased by 4 cents to $20.61.
The change in total non-farm payroll employment for May was revised from +224,000 to +229,000, and the change for June was revised from +288,000 to +298,000. With these revisions, employment gains in May and June were 15,000 higher than previously reported.
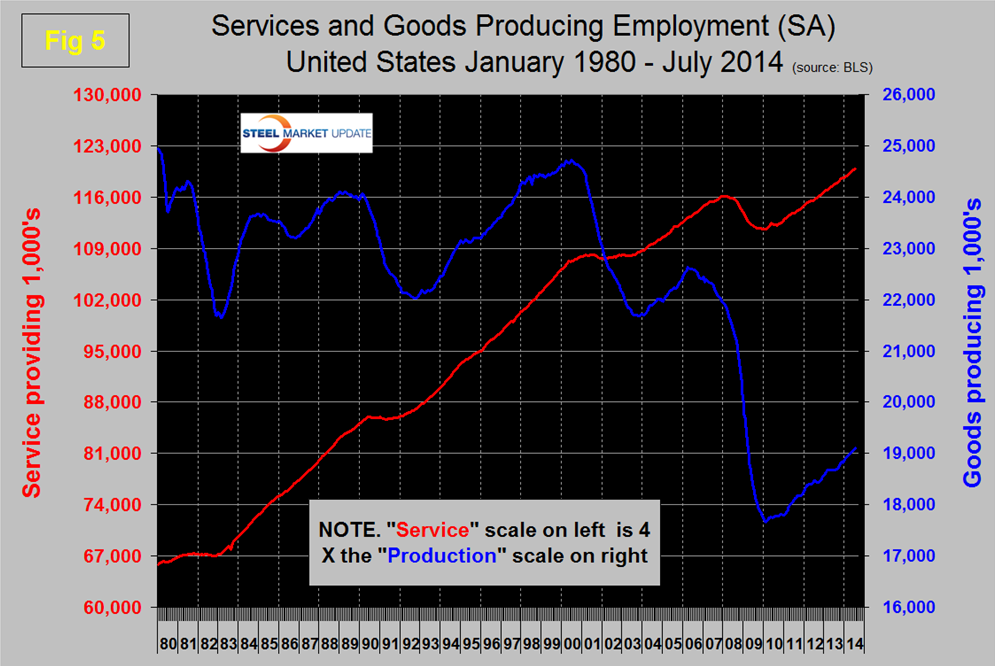
SMU Comment: The recovery in total non-farm employment is now looking stronger than the 2003 to 2007 time frame but economists still have concerns because the low income level of jobs being created which translates to a slower improvement in total disposable income. The US economy has dramatically transformed in the direction of service industries in preference to goods producing, (Figure 5) and many of the service jobs are low income. Disposable income drives almost 70 percent of GDP which in turn strongly influences steel consumption.