Market Segment
August 19, 2014
Service Center Shipments the Best for any July since 2008
Written by Peter Wright
Total service center carbon steel shipments in July increased by 11,600 tons to 3.539 million tons. Shipping days also increased, from 21 to 22. On a tons per day basis, (t/d) shipments decreased from 168,000 tons in June to 160,900 in July but the latest data has the best shipments of any July since 2008. Since 2004 there has only been one year when shipments did not decline in July on a t/d basis and daily shipments this July were up from 150.7 thousand tons in July last year. Comparing a month’s performance with the previous month is frequently misleading because of seasonal effects which is why in this analysis we always consider year over year changes.
Table 1 shows the performance by product in July compared to the same month last year and also with the average t/d for July 2014, July 2013 and July 2012. We then calculate the percent change between July 2014 and July 2013 and with the 3 year July average. We hope this give the best view of market direction. Shipments of all products on a t/d basis were up by 6.8 percent from July last year and up by 4.6 percent from the average July shipments for 2014, 2013 and 2012. The fact that the single month comparison has a greater improvement than the three year comparison leads us to the conclusion that the improvement is accelerating. This is particularly true of plate and carbon bar. All products had positive shipment growth on both time comparisons but structurals continue to lag the others. Sheet products were up by 7.0 percent year over year and by 5.5 percent in the three year comparison.
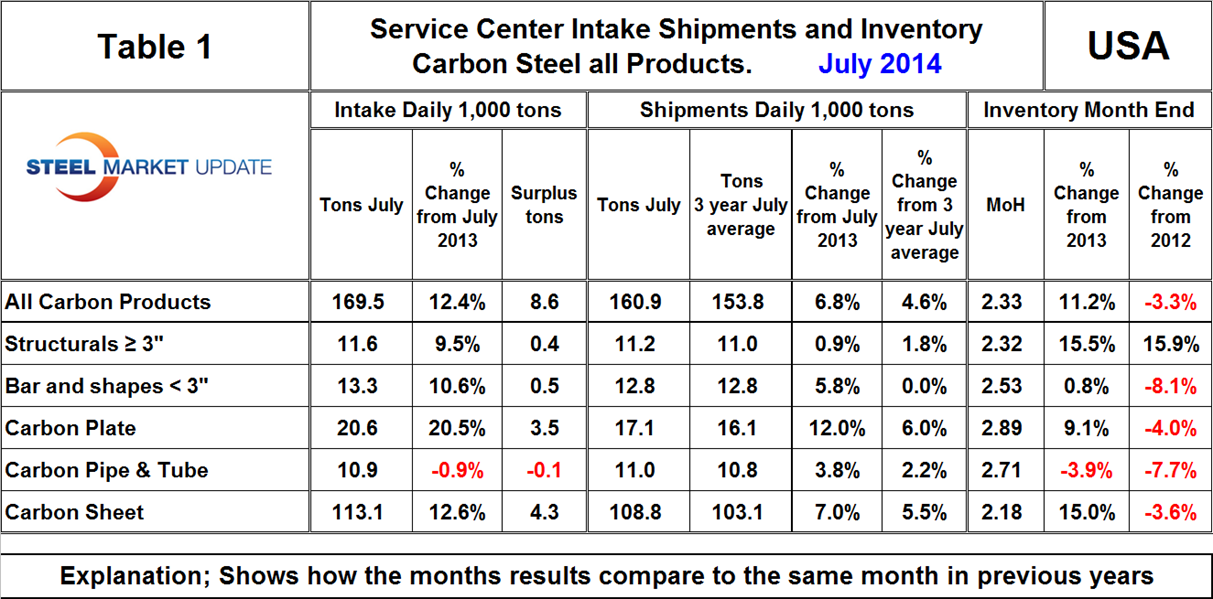
July total carbon steel intake decreased by 3,400 t/d, but there was still an intake surplus of 8,600 t/d. All products except pipe and tube had an intake surplus. Months on hand (MoH) increased from 2.28 at the end of June to 2.33 at the end of July.
Compared to the end of June last year, moth end inventories were up by 11.2 percent in total, with structurals leading the way with increases of 15.5 percent. There has been quite a bit of optimism recently about the prospects for nonresidential construction and service centers seem to be responding by increasing their structural inventory. Sheet product inventories were up by 15.0 percent year over year but MoH only reached 2.18 at month end.
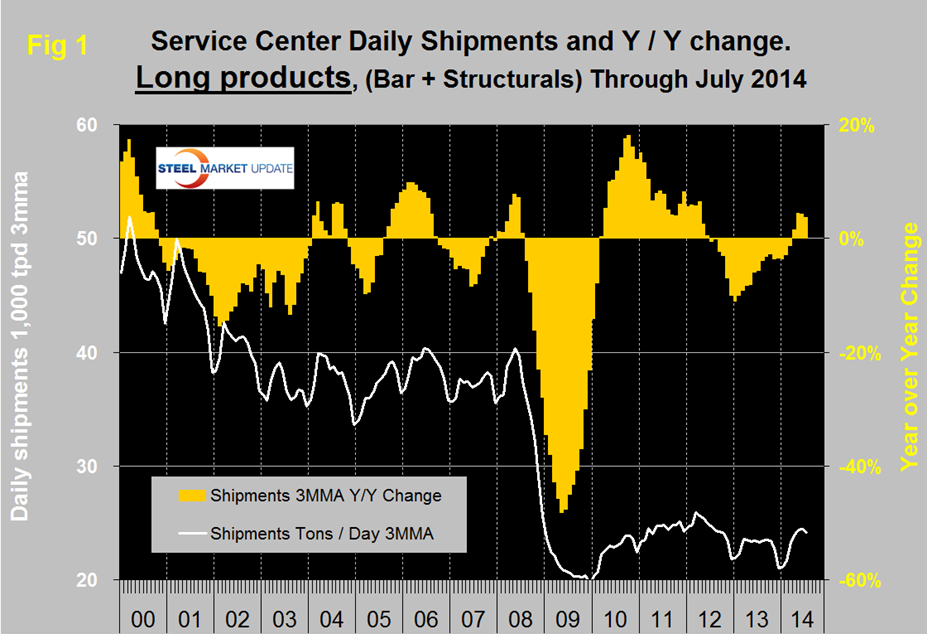
There continues to be a wide difference between the performances of flat rolled (sheet + plate) and long products (structurals + bar) at the service center level. Long products have had a very poor recovery from the recession. On a 3MMA basis y/y, the growth of shipments was negative for 21 straight months until April this year which was the first of four straight months of growth, (Figure 1).
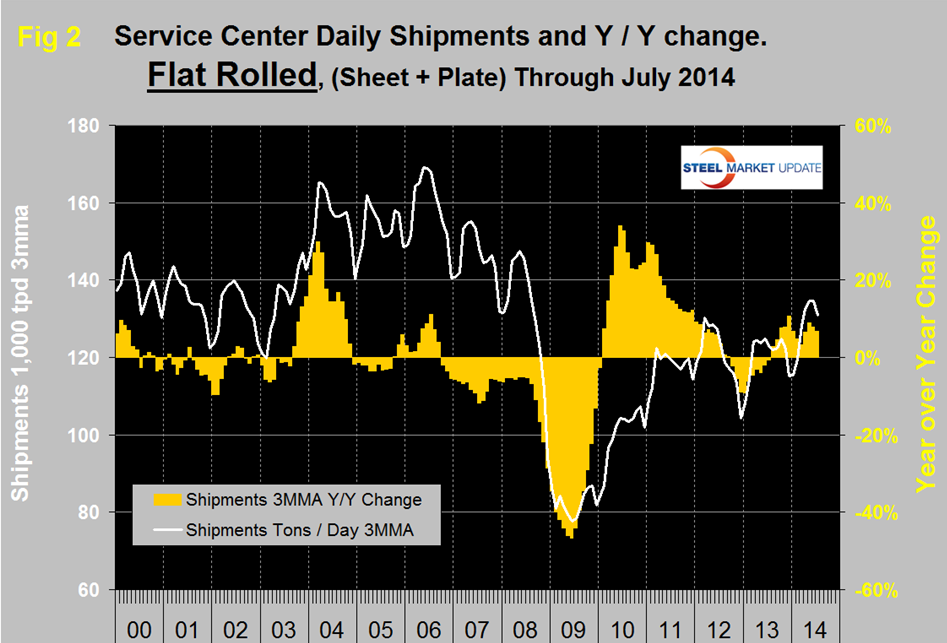
Flat rolled has had a much better recovery since mid-2009 and has had positive y/y growth in each of the last twelve months, (Figure 2).
In 2006 and 2007, the mills and service centers were operating at maximum capacity. Figure 3 takes the shipments by product since that time frame and indexes them to the average for 2006 and 2007 in order to measure the extent to which service center shipments of each product have recovered. Again it can be seen that bar and structurals have the worst record. Sheet has had the best recovery overall but the July doldrums are obvious. The total of carbon steel products is now at 75.8 percent of the shipping rate that existed in 2006 and 2007, ranging from sheet products at 83.1 percent to structurals at 63.1 percent. The recovery of the service center sector has been much slower than has been experienced by the mills. Presumably this is because in a relatively lack luster market, more buyers are buying mill direct and this is probably particularly true of long products. In addition long products being more construction oriented are suffering from the slow recovery of that business sector.
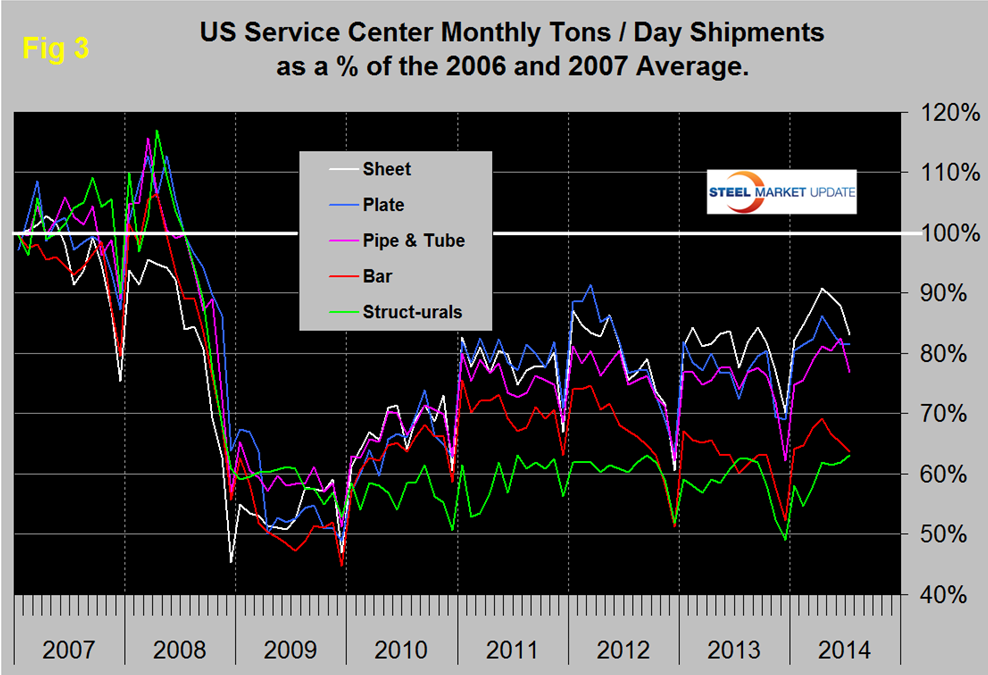
MSCI uses product nomenclature flat and plate. In our analysis at SMU we replace the term flat with sheet. By our interpretation of the MSCI’s data their definition of “flat” is all hot rolled, cold rolled and coated sheet products. Since most of our readers are sheet oriented we have removed plate from Figure 3 to highlight the history of sheet products which are shown in (Figure 4). Positive year over year growth has occurred in each of the last twelve months following nine consecutive months of decline.
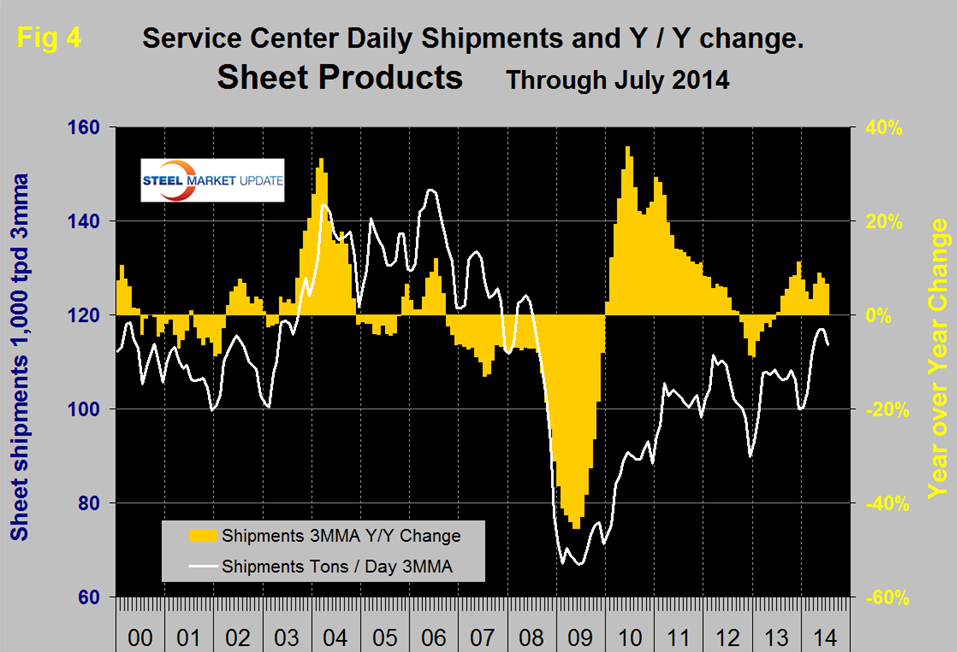
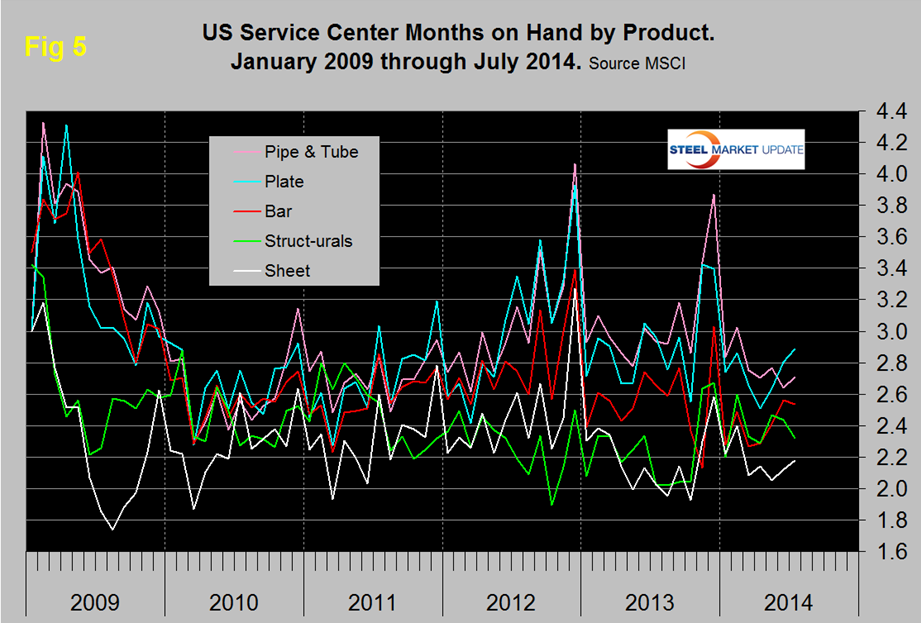
Figure 5 shows the change of inventory at service centers since 2009 measured as months on hand at month end. Plate had a strong increase in July, sheet was also up significantly. Sheet products constitute by far the largest segment of service center’s business, have had the best inventory management since 2009 and currently have the lowest months on hand. Structurals MoH decreased from 2.43 at the end of June to 2.34 at the end of July.