

Analysis
September 16, 2014
US Vehicle Sales and NAFTA Vehicle Production, August 2014
Written by Peter Wright
The following article was produced by Peter Wright, contributing writer and Steel 101 instructor for Steel Market Update.
Economy.com reported as follows on the August U.S. vehicles sales volume: the year-to-date pace of 16.4 million units SAAR is the best since 2006, when it was 16.55 million. The strong recovery of the U.S. auto industry rests on a number of factors including the steadily improving labor market, the release of pent-up demand, improving consumer confidence, the increased availability of auto credit and incentives. Moody’s Analytics is now forecasting a pace of 16.7 million units in 2015.
Total light vehicle production in NAFTA in August was at an annual rate of 17,076,936 units, up by 16.0% from July which co-incidentally was down 16.0% from June. This was the normal July re-tooling slowdown. Note: these production numbers are not seasonally adjusted, the sales data reported above are seasonally adjusted. On a rolling 12 months basis y / y light vehicle production in NAFTA increased by 5.6% and is now well above the pre-recession peak, (Fig 1).
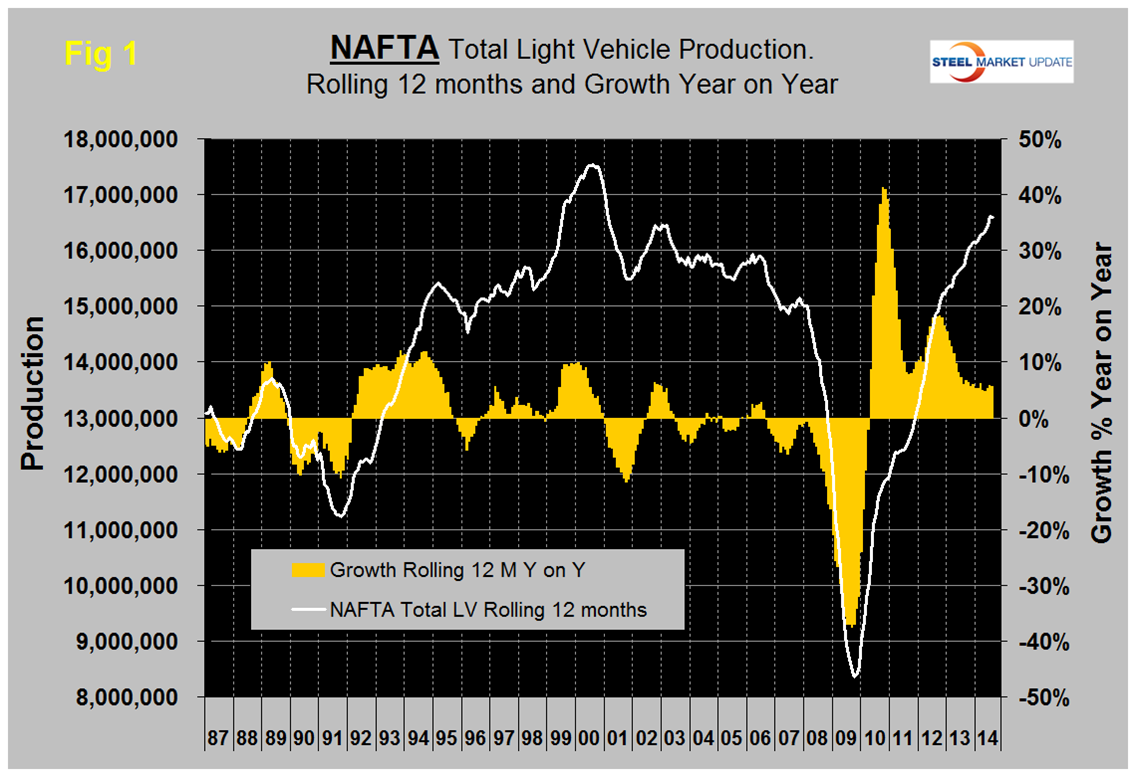
On this basis the US is up by 8.1%, Canada is down by 2.6% and Mexico is up by 3.4%, (Table 1). For NAFTA as a whole on a rolling 12 month basis year over year, light truck production is up by 11.2% and autos are down by 1.2%. A time comparison such as this is very strong evidence of a long term shift in consumer preference, probably driven by the crossover sub set of light trucks.
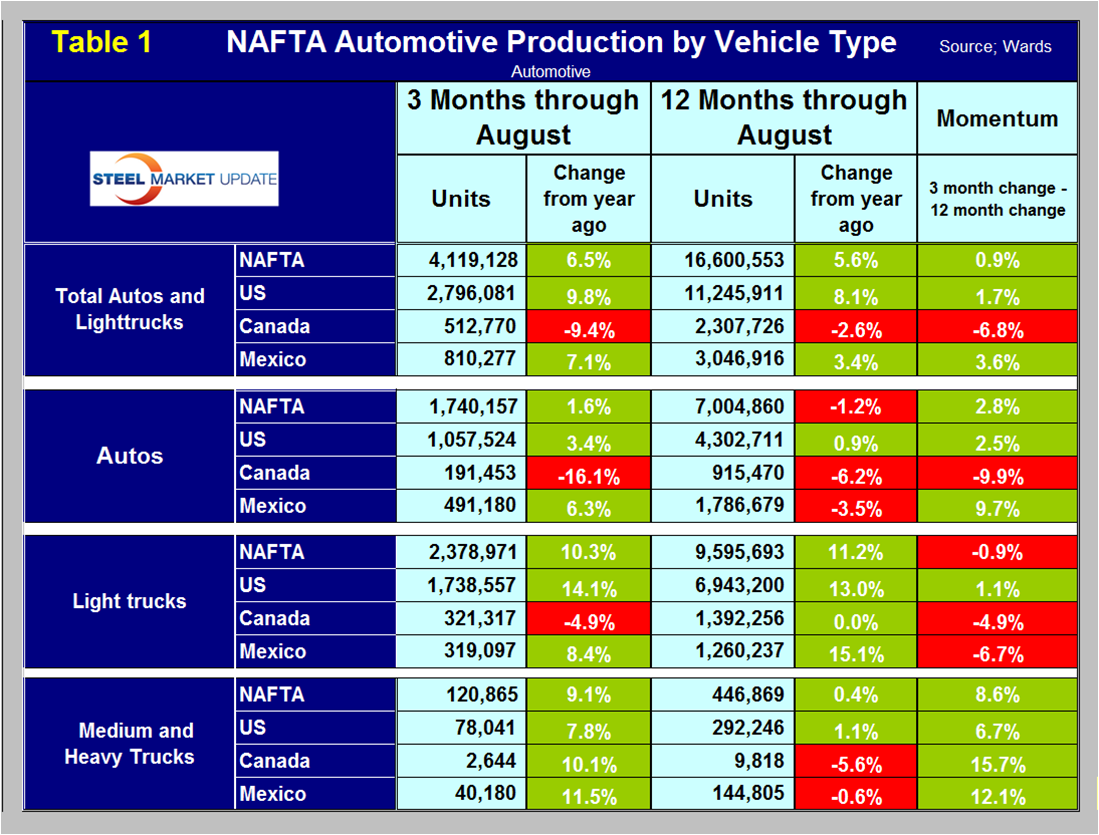
Figure 2 shows the production of light vehicles in the US and the growth rate on a 12 month rolling average basis. Growth has been fairly consistent for the last 15 months and has averaged 7.9% in that period. Production is now at a level not seen since July 2006. The mix of autos and light trucks in the US is now 38:62.
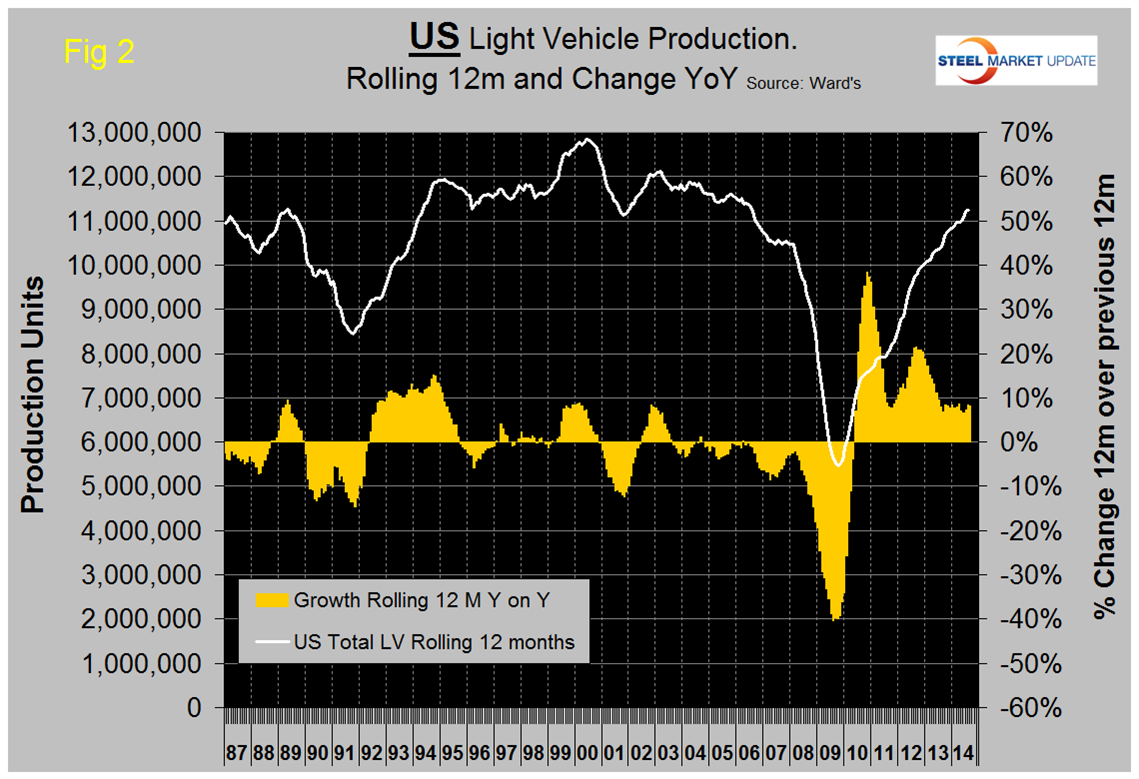
Figure 3 shows the same analysis for Canada. Growth of light vehicle production in Canada has been negative for the last 13 months and has averaged -1.7% in that period. Canadian production is still lower than it was in late 2007. The mix of autos and light trucks in Canada today is almost the same as in the US at 37:63.
Figure 4 shows the same analysis for Mexico. The growth of light vehicle production in Mexico slowed dramatically late last year and in 2014 has averaged 3.1%, less than half that in the US. However, Mexican production is 50% higher than it was before the recession. The mix of autos and light trucks in Mexico is now 61:39, almost the opposite of what prevails in the US and Canada.
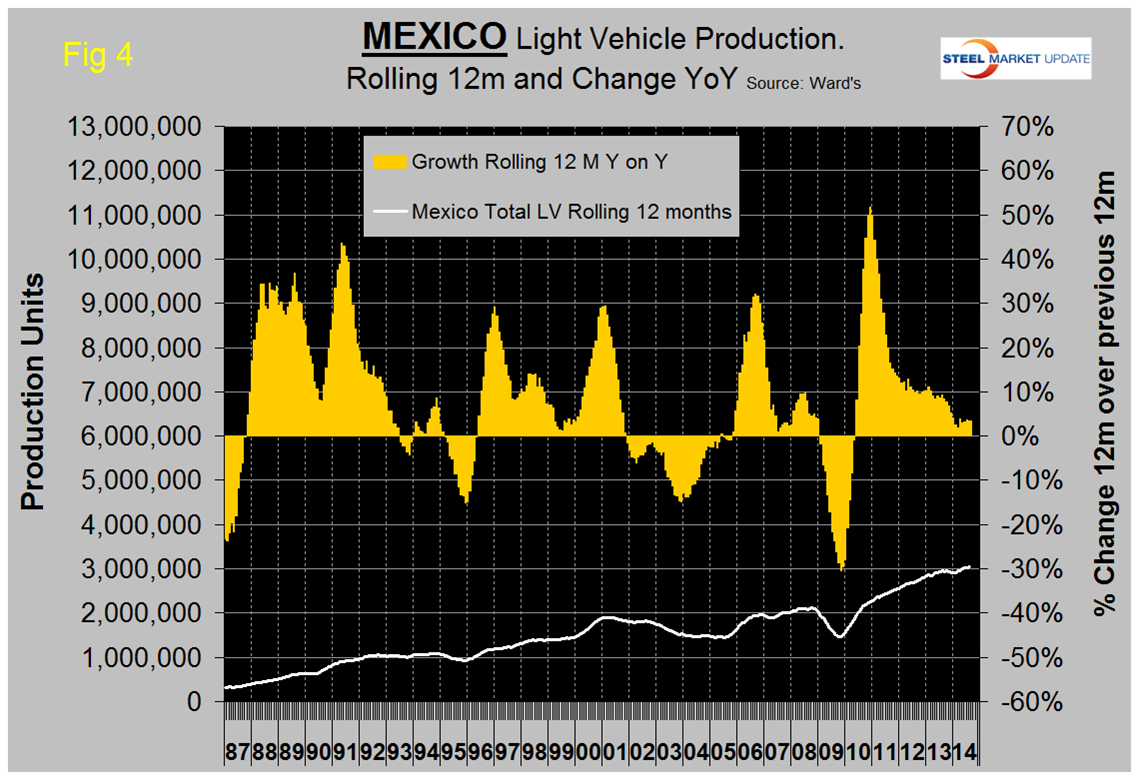
Note the scales on Figures 3, 4 and 5 are identical to allow an accurate visual comparison.
Ward’s Automotive reported last week that light vehicle inventories declined by six days of sales in August to 55 days. Inventories of the Detroit 3 decreased by seven to 69, the Asian manufacturers declined by five to 42, and the Europeans declined by three to 53.
The SMU data file contains more detail than be shown here in this condensed report. Readers can obtain copies of additional time based performance results on request if they wish to dig deeper. Available are graphs of auto, light truck and medium and heavy truck production and growth rate by country and production share of light vehicles by country broken out into autos and light trucks.
There are two technological developments on the horizon that will, if successful have a negative effect on steel consumption in automobiles. The last steel bodies Ford F150 rolled off the Dearborn production line on August 23rd. The plant has been closed and will be down into October as equipment for production of the aluminum intensive 2015 is installed. Power to weight ratio will be increased by about 15% due not only to the use of aluminum but also to the replacement of a 5L V8 with a twin turbo 2.7L V6 and the increased use of high strength steel. Lost production during the outage will be over 30,000 trucks.
The development of electrically powered vehicles seems to be having some success. From Don Dion in Seeking Alpha September 4th. GM is trying to compete with Tesla, offering its Volt model for a lower price of $35,000. Increased competition is a good sign for Tesla, which has already given up its patent rights to support more supply and demand for electric vehicles. Tesla has posted solid results for the past six quarters and has attracted interest from both the private and public sectors.
Competition from GM – Signs of a Strong, Growing Industry
Tesla already has their premier 85-kW model, which can attain 265 miles on a single charge, albeit at an $80,000 price tag, and the $70,000 Tesla S, which can go 208 miles between charges.
•General Motors is trying to give Tesla some competition in the electric car arena, and although the GM Volt is not quite in the same class as the Tesla, the $35,000 price point is GM’s bread and butter market, and they have recently upped the ante. LG Chemical, GM’s battery supplier, announced that a lithium ion battery that can reach 200 miles will be available in 2016.
•New Graphene-Based Anodes Could Lead To 500-Mile Lasting Batteries–Tesla continues to push the cutting edge of its R&D, and Musk made an announcement to China’s Xinhua News Agency recently about their development of graphene based anodes, which theoretically can quadruple the energy output of lithium ion batteries, making a 500 mile battery achievable.
•Graphene, which is so thin as to be almost transparent when laid out in sheet form, is excellent for battery use due its highly conductive energy and heat properties while maintaining a tensile strength much higher than that of steel. In a Rice University study, graphene combined with vanadium oxide created battery cathodes that could recharge in 20 seconds and retain 90% capacity even after 1000 recharging cycles. This would be a major advantage over the current lithium ion batteries in use by the Tesla S, which takes about a half hour for a complete recharge.


