

Analysis
October 3, 2014
Construction Expenditures through August 2014
Written by Peter Wright
Each month the Commerce Department issues its Construction Put in Place (CPIP) data on the first working day covering activity two months earlier. August data was released on October 1st. Construction put in place is based on spending work as it occurs, estimated for a given month from a sample of projects. In effect the value of a project is spread out from the project’s start to its completion. Construction starts data published by the Commerce Department for residential construction and by McGraw Hill Dodge and Reed Construction for non-residential is completely different as in these cases the whole project is entered to the data base when ground is broken. The official CPIP press report gives no idea of expenditures on a historical basis and provides a very poor review of trends. The detail is hidden in the published data tables which we at SMU dissect to try to provide some meaningful guidance for our readers who are dependent on this industry.
Total Construction: Data is reported on both a seasonally adjusted and non-adjusted basis. In the SMU analysis we consider only the non-seasonally adjusted data and remove seasonality by the consideration of year over year (y/y) data. We also focus on rolling 3 and 12 months to remove the noise in single month numbers. Please note that the official news release from the Commerce Department may at first glance seem to conflict with the SMU analyses because the government commentary is all about seasonally adjusted numbers.
August expenditures were $89.3 billion which breaks down to $61.2 B of private work, and $26.1 B of state and locally, (S&L) funded work and $1.97 B of federally funded, (Table 1).
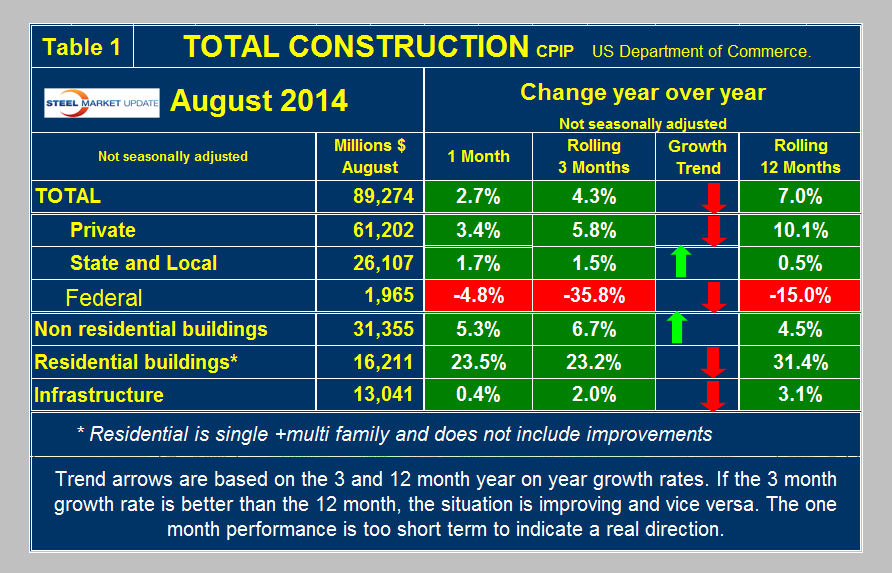
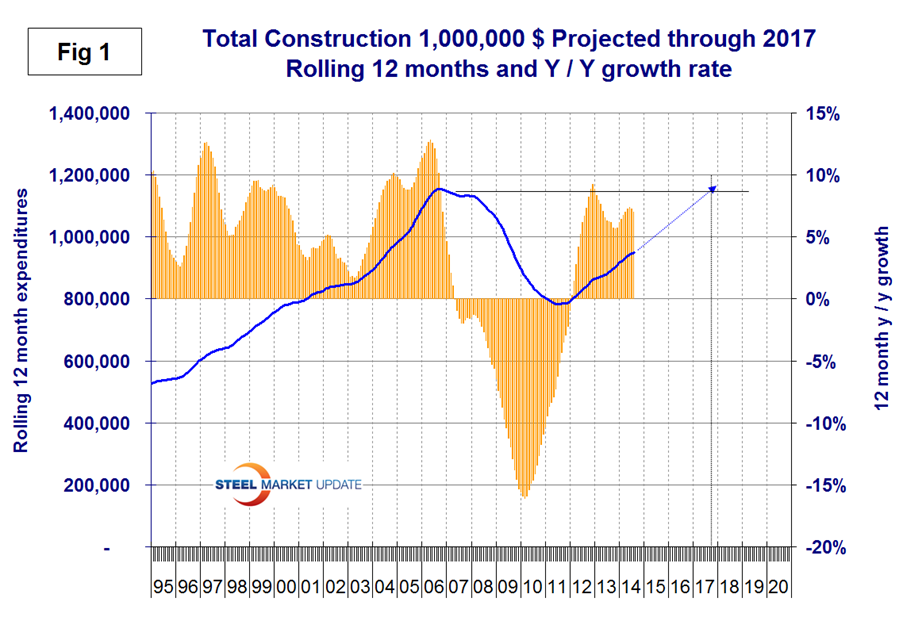
On a rolling three month basis total construction was up by 4.3 percent y/y, a decline from 6.6 percent in our last report. On a rolling 12 month basis y/y total construction was up by 7.0 percent, down from 7.5 percent in July. This means that total construction growth is decelerating slightly since the short term growth (3 months) is less than the long term, (12 months). Note this is not a seasonal effect because our y/y analysis removes seasonality. Private work had negative momentum in August but state and local momentum was positive, both trends the same as they were in the June and July results. We consider three sectors within total construction. These are non-residential, residential and infrastructure. On a rolling three month basis y/y non-residential is growing at 6.7 percent and accelerating. Residential is growing at 23.2 percent and slowing. Infrastructure grew 2.0 percent y/y and decelerated in the last three months compared to the rolling 12 month number. The growth of total construction improved from December through June but declined slightly in July and August. At the current rate it will be Q3 2017 before the pre-recessionary peak is regained, (Figure 1). The pre-recession peak of total construction on a rolling 12 month basis was $1,145 B in 12 months through February 2007. The low point was $768 B in 12 months through May 2011. The 12 month total through the latest data of August 2014 was $950.6 B.
Private Construction: In the August data, private work decelerated significantly from a 10.1 percent growth rate in 12 months y/y to a 5.8 percent rate in 3 months y/y, (Table 2).
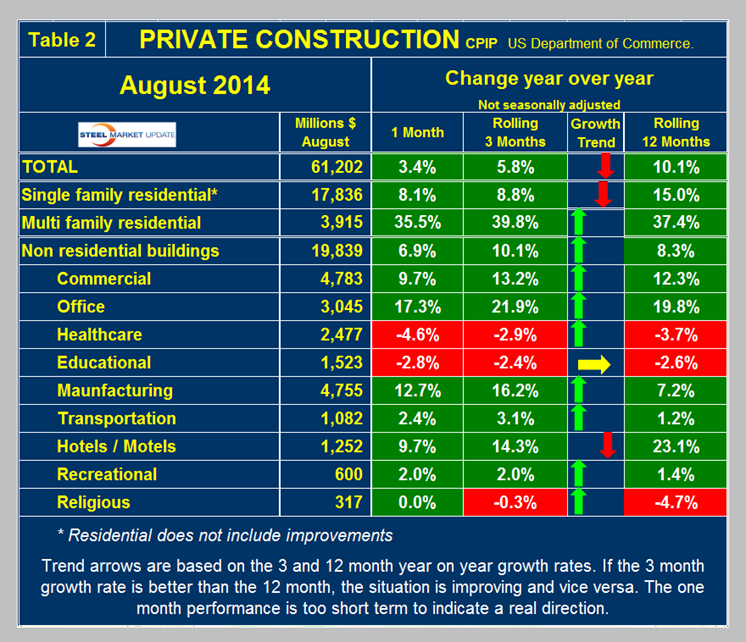
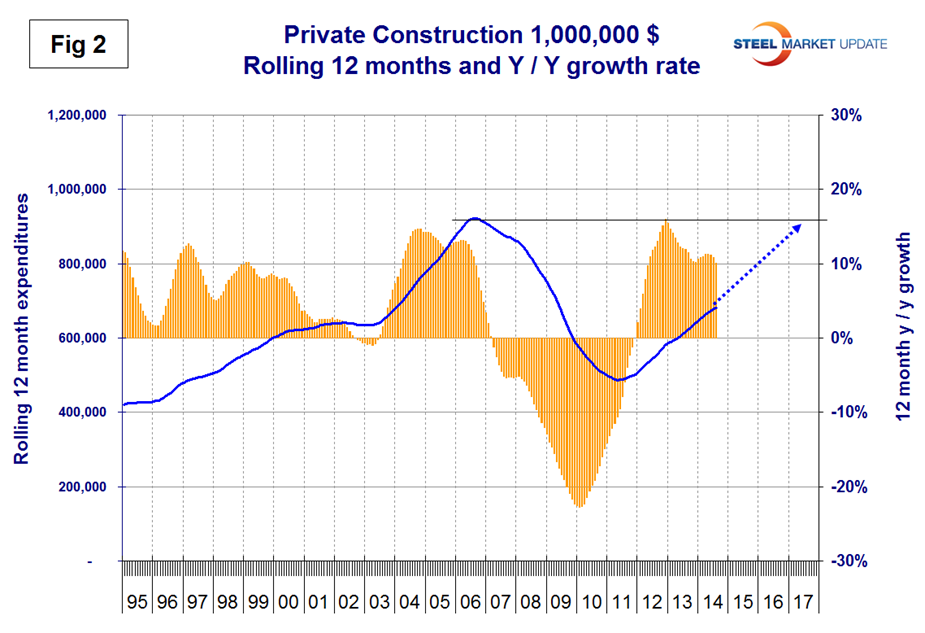
On a rolling 12 month basis the growth of private work has exceeded 10 percent for the last 24 months but at the current rate it will be late 2017 before recovery is complete, (Figure 2). Table 2 breaks down the private sector into project types. Residential buildings, both single and multi-family still have strong y / y growth but single family is slowing dramatically as multi family is still accelerating. This data coincides well with the housing starts data from the Census Bureau which has single family growing at 4.5 percent rate and multifamily growing at 35.9 percent. Private non-residential buildings grew at a 10.1 percent rate in three months through August y/y with a positive momentum. Within private non-residential, only health care, educational and religious buildings had negative growth. Offices, manufacturing, hotels / motels and commercial had strong year over year growth in three months through August.
State and Local Construction: S&L work expanded by 1.72 percent in the single month of August y/y and grew by 1.5 percent in the rolling three months through August y/y. (Table 3).
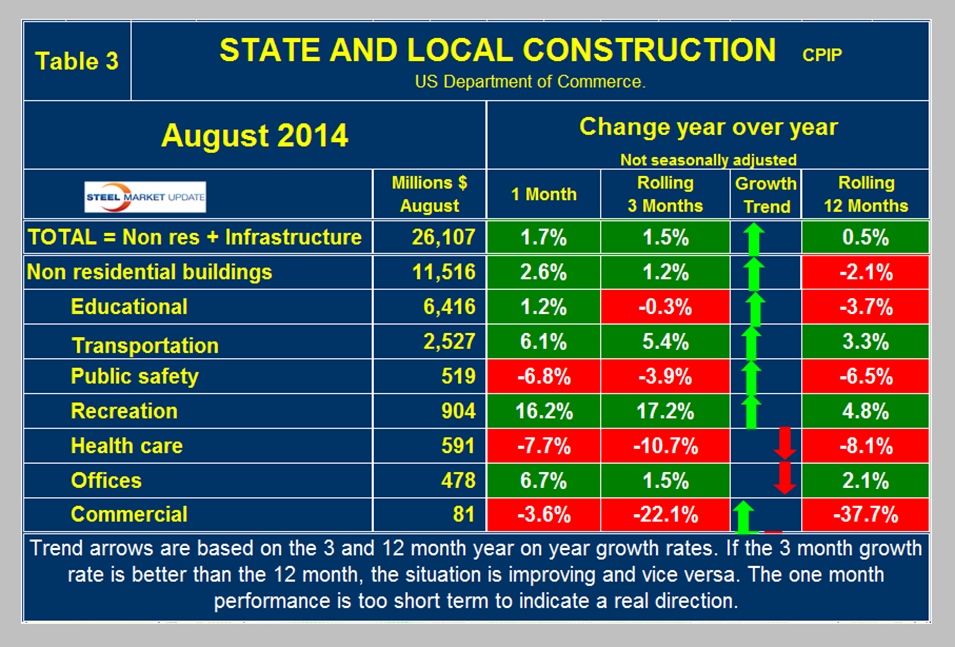
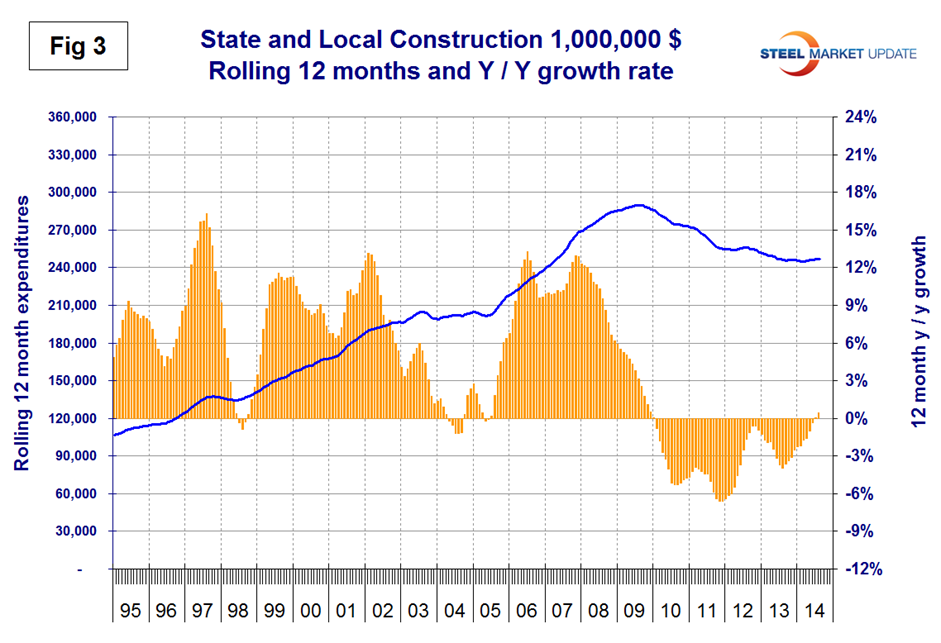
This was the fourth consecutive month of positive y/y growth on a rolling three months basis, the first time that has happened in four years and it was the first time in 47 months for growth on a rolling 12 month basis to break positive, (Figure 3). S&L non-residential building grew by 1.2 percent in three months through August y/y, and momentum continues to be positive. Educational buildings are about 75 percent funded by state and local governments and are by far the largest sub sector of S&L non-residential at almost $6.4 billion in August. Recreational buildings have accelerated markedly in the last four months and grew by 17.2 percent in the latest data making this the strongest sector within State and Local. Transportation terminals continue to do well and offices had minimal though positive growth. The recreational expenditures seem to fly in the face of data describing the State’s fiscal balances. Many state and local governments are far from healthy, as increased revenues have been more than offset by increased future obligations, including the need to replenish reserve and rainy-day funds and to service defined benefit liabilities, pensions and Medicaid foremost. Considering the financial weakness of many sub-national governments, it will be many years before public construction catches up to pre-recession levels.
Drilling down into the private and S&L sectors as presented in Tables 2 and 3 shows which project types should be targeted for steel sales and which should be avoided. There are some project types within S&L that are doing quite well but there are also major regional differences to be considered.
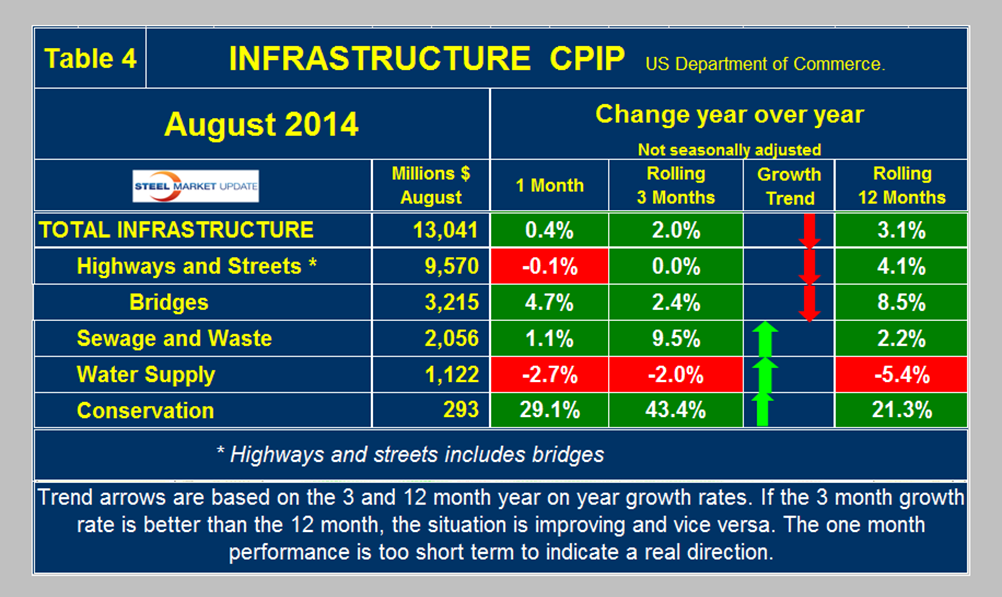
Infrastructure: Expenditures have had positive growth in each of the last twelve months through August on a rolling 3 months basis with a + 2.0 percent result in the latest data. The growth in three months is slower than that in 12 months meaning that momentum slowed as a result of protracted negotiations in Washington before the issue of highway trust fund had some limited resolution. Highway pavement expenditures have grown for the last nine months but slowed to only just over a zero percent rate in three months through August y/y. This is a sub component of Highways and Streets as is bridges which have had positive growth for the last fourteen months, (Table 4).
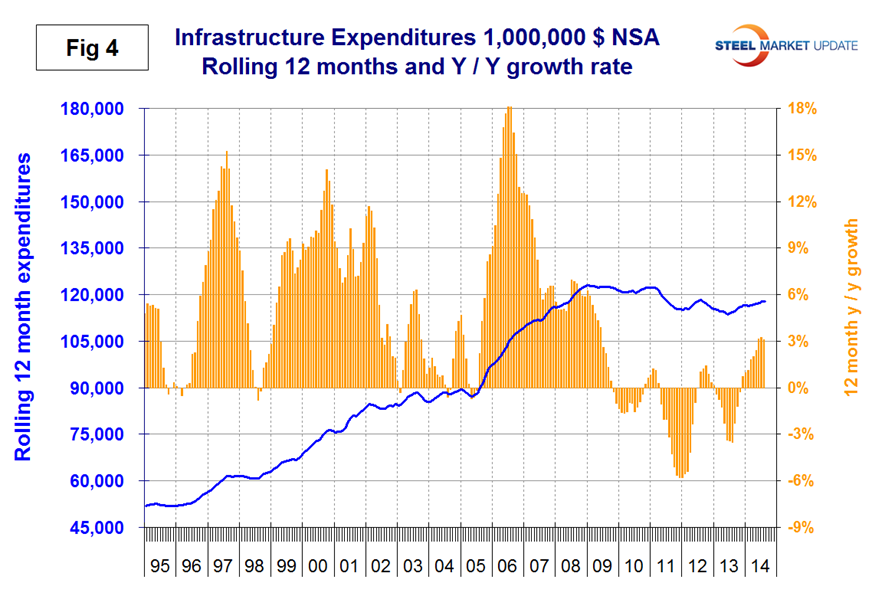
Water supply continued to contract through July though more slowly. There has been a surge in conservation expenditures this year but the outlays are relatively small. On a rolling 12 month basis, infrastructure expenditures are about where they were three years ago. (Figure 4).
On September 28th the Washington Blog briefing room reported: In August, the president signed a $10.8 billion measure that will fund highway and bridge repairs for the next ten months. The short-term measure will set up a dramatic fight next year over how to best fund highway and bridge repairs down the line. At the time, Obama said Congress “shouldn’t pat itself on the back for averting disaster for a few months, kicking the can down the road for a few months, careening from crisis to crisis when it comes to something as basic as our infrastructure.” Transportation Secretary Anthony Foxx also said he was “disappointed” that bridge and highway repairs would again be endangered. “This latest band-aid expires right as the next construction season begins, setting up another crisis next spring,” Foxx said. Both the president and Republicans have also signaled a willingness to reform the corporate tax code, although wide gulfs exist between proposals to best do so. The president has said he would lower corporate tax rates from 35 to 28 percent in exchange for boosting spending on jobs and infrastructure programs. The administration would also allow small businesses to write off as much as $1 million in investments, and would allow companies to repatriate earnings to the U.S. subject to a “transition fee.” But Republicans have said any plan needs to be revenue neutral and think any additional tax dollars collected under the plan should be applied to lowering tax rates overall.
The press release from the Commerce Department on Friday read as follows:
August 2014 Construction AT $961.0 Billion Annual Rate
The U.S. Census Bureau of the Department of Commerce announced today that construction spending during August 2014 was estimated at a seasonally adjusted annual rate of $961.0 billion, 0.8 percent below the revised July estimate of $968.8 billion. The August figure is 5.0 percent above the August 2013 estimate of $915.3 billion.
During the first 8 months of this year, construction spending amounted to $623.1 billion, 6.8 percent above the $583.2 billion for the same period in 2013.
Private Construction
Spending on private construction was at a seasonally adjusted annual rate of $685.0 billion, 0.8 percent below the revised July estimate of $690.3 billion. Residential construction was at a seasonally adjusted annual rate of $351.7 billion in August, 0.1 percent below the revised July estimate of $352.1 billion. Nonresidential construction was at a seasonally adjusted annual rate of $333.3 billion in August, 1.4 percent below the revised July estimate of $338.1 billion.
Public Construction
In August, the estimated seasonally adjusted annual rate of public construction spending was $275.9 billion, 0.9 percent below the revised July estimate of $278.5 billion. Educational construction was at a seasonally adjusted annual rate of $62.3 billion, 2.9 percent below the revised July estimate of $64.1 billion. Highway construction was at a seasonally adjusted annual rate of $83.3 billion, 0.6 percent below the revised July estimate of $83.8 billion.


