

Analysis
October 19, 2014
Housing Starts, Permits and Builder Confidence through September 2014
Written by Peter Wright
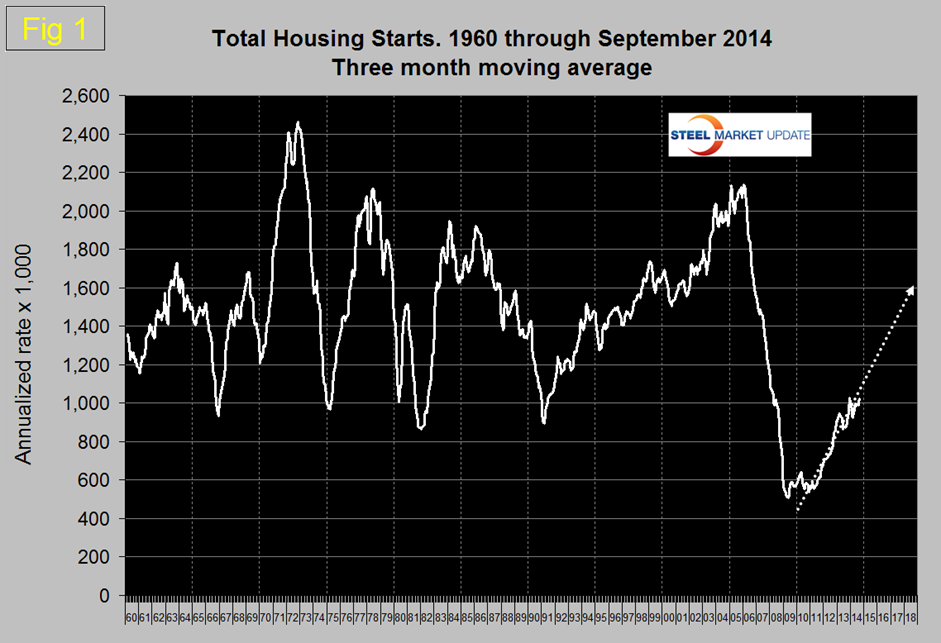
Housing starts in September increased to an annual rate of 1,017,000 units from 957,000 in August. The three month moving average (3MMA) increased from 988,000 to 1,024,000 units, (Figure 1). This was the first time since January that the 3MMA had exceeded a million units. The year over year growth rate of the 3MMA of total starts in September was 16.1 percent. Total starts are still on track to reach 1.6 million by the end of 2018.
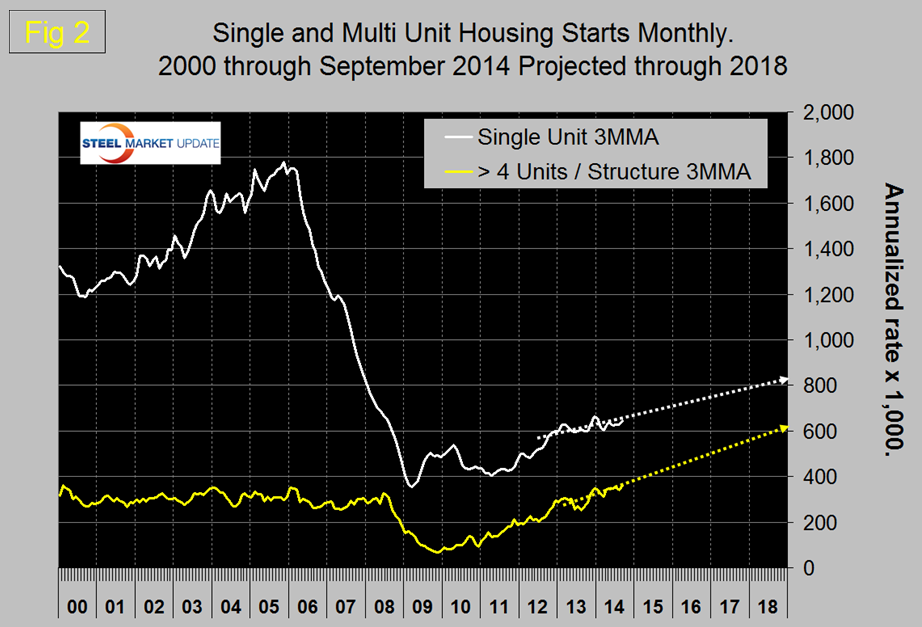
Multi-family starts are now beyond the pre-recession high but single family continues to struggle, (Figure 2).
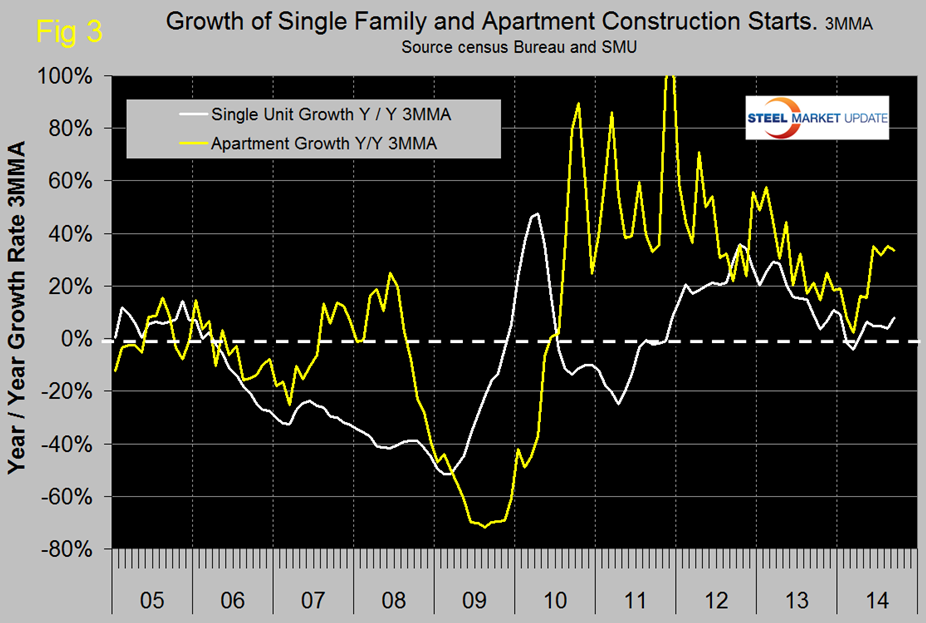
The growth rate of multifamily has been consistently in the 32 percent to 35 percent range in the last four months as single family has languished in the 4 percent to 8 percent range, (Figure 3). Both on a 3MMA year over year basis.
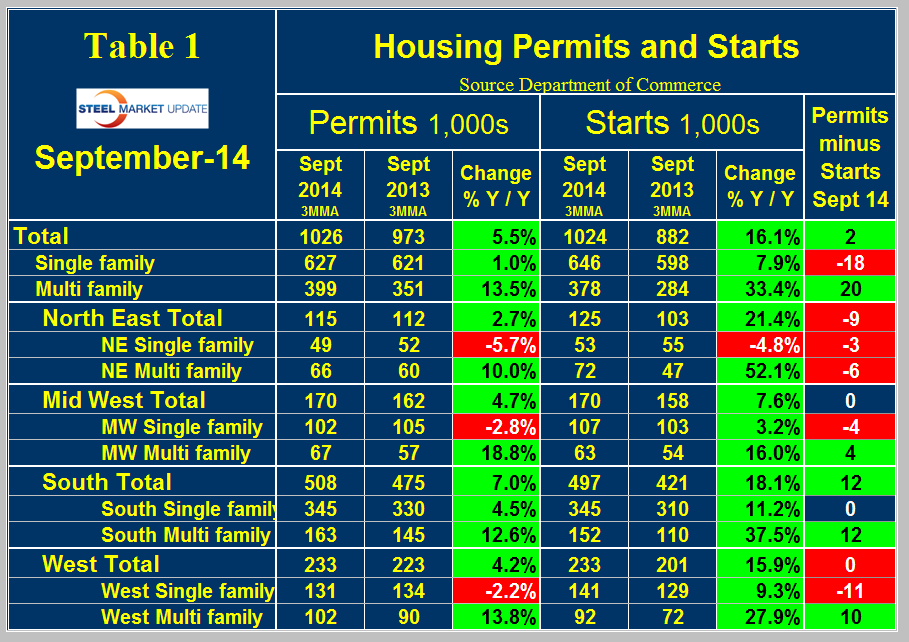
Permit data is useful to evaluate where future starts are headed. If permits exceed starts then we anticipate an acceleration and vice versa. Table 1 shows that total permits did exceeded starts by 2,000 in September on a 3MMA basis. However the situation is dramatically different for single and multi-family units. Single family permits were 18,000 less than starts and multi-family permits were 20,000 more than starts. This signals a future acceleration in multi-family and a deceleration in single family.
The ratio of the two sectors is shown in Figure 4 and demonstrates that single family compared to multi-family is less desirable than at any time in the last 30 years.
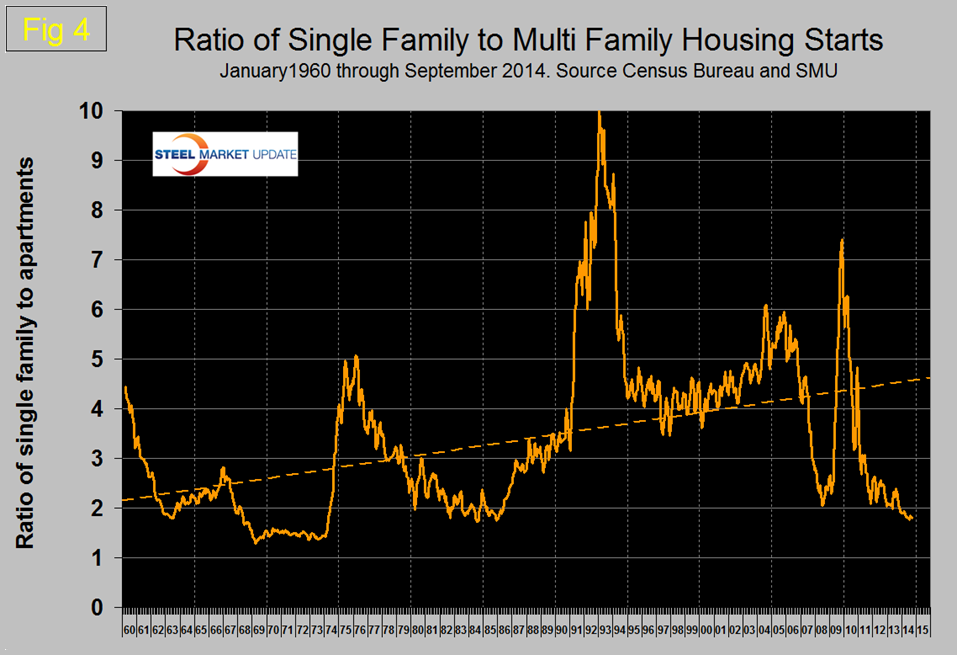
Based on permit data this trend will not change any time soon. The situation in the four regions reported in the census Bureau report were not a mirror of that at the national level in September. All regions except the South had a decline in single family permits year over year and the North East had a decline in single family starts. Figure 5 shows the regional situation for total residential starts since January 2000. The dramatic change in the consumer’s view of how he/she wants to live is accelerating. The balloon in student loan debt is one of the fuels of this trend but so presumably is the view that housing is not necessarily the great investment that it was once thought to be. In addition, uncertainty in the job market makes mobility desirable and promotes the idea of rent in preference to purchase.
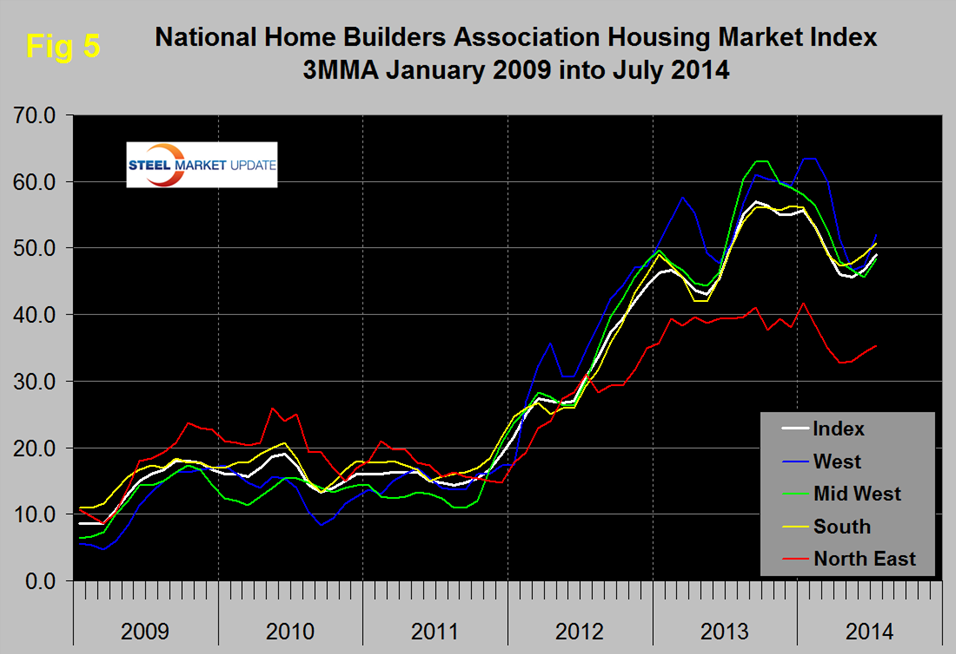
The National Association of Home Builders (NAHB) confidence report was released on Thursday. Any value above 50 indicates an overall positive business confidence. The index declined by 5 points to 54 but the 3MMA continued to advance and reached 56, the highest value since October last year. The composite index, signals that homebuilders are generally positive in their views of the market.
The official release from the NAHB read as follows:
Four-Month Upturn Ends as Builder Confidence Falls in October
October 16, 2014 – After four consecutive monthly gains, builder confidence in the market for newly built single-family homes fell five points to a level of 54 on the National Association of Home Builders/Wells Fargo Housing Market Index (HMI), released today.
“We are seeing a return to the mid-50s index level trend established earlier in the summer, which is in line with the gradual pace of the housing recovery,” said NAHB Chairman Kevin Kelly, a home builder and developer from Wilmington, Del.
“While there was a dip this month, builders are still positive about the housing market.” “After the HMI posted a nine-year high in September, it’s not surprising to see the number drop in October,” said NAHB Chief Economist David Crowe. “However, historically low mortgage interest rates, steady job gains, and significant pent up demand all point to continued growth of the housing market.”
Derived from a monthly survey that NAHB has been conducting for 30 years, the NAHB/Wells Fargo Housing Market Index gauges builder perceptions of current single-family home sales and sales expectations for the next six months as “good,” “fair” or “poor.” The survey also asks builders to rate traffic of prospective buyers as “high to very high,” “average” or “low to very low.” Scores from each component are then used to calculate a seasonally adjusted index where any number over 50 indicates that more builders view conditions as good than poor.
All three HMI components declined in October. The index gauging current sales conditions decreased six points to 57, while the index measuring expectations for future sales slipped three points to 64 and the index gauging traffic of prospective buyers dropped six points to 41.
Looking at the three-month moving averages for regional HMI scores, the Northeast and Midwest remained flat at 41 and 59, respectively. The South rose two points to 58 and the West registered a one-point loss to 57.
Editor’s Note: The NAHB/Wells Fargo Housing Market Index is strictly the product of NAHB Economics, and is not seen or influenced by any outside party prior to being released to the public. HMI tables can be found at www.nahb.org/hmi. More information on housing statistics is also available at www.HousingEconomics.com.
SMU Comment: Even though the steel content of housing is only a small proportion of total steel consumption, housing is a leading indicator of many construction sectors such as non-residential and sub sectors of infrastructure and has a large multiplier effect in the economy as a whole. To the extent that readers’ businesses are influenced by the relative size of the two housing sectors, they should plan for further continued growth of apartment construction and a single family sector that continues to struggle.


