Analysis

November 20, 2014
US Vehicle Sales & NAFTA Vehicle Production
Written by Peter Wright
Total light vehicle sales were little changed in October at 16.5 million units, up from 16.4 million in September, both on a seasonally adjusted annualized basis. The spread between light trucks and autos, which in September was one million units in favor of light trucks, decreased to 0.5 million.
On a y/y basis total light vehicle sales in October were up by 6.1 percent as a result of a 9.0 increase in light truck sales and 2.9 percent increase in automobile sales. The Detroit three accounted for 45.7 percent of October sales and Japanese manufacturers achieved a share of just under 32 percent. Import market share was 20.6 percent down from 22.5 percent in June. Moody’s Analytics expects vehicle sales to remain well above 16 million units in the near term and approach near 17 million units in 2015.
On November 11th the first F150 with an aluminum skin rolled off the Dearborn production line. Chrysler has announced that the 2017 Ram 1500 will feature a mostly steel body.
Total light vehicle production in NAFTA in October was at an annual rate of 19,198,000 units, up by 8.0 percent from September. Over the last 10 years October production on average has been the highest month of the year but even so this October was rather extraordinary and unsustainable. Production in October was higher than any of the 30 months since January 2004 and the three month moving average (3MMA) at 18,016,000 was the highest since June 2002. All of this surge was in Mexico. The month over month increase in the US, Canada and Mexico was 8.0 percent, 5.9 percent and 23.4 percent respectively. The increase in the US and Canada for October was normal, that of Mexico was anything but. We have seen nothing in the press to explain this, in fact we understand that the capital expenditure plans currently being implemented in the US are five time those for Mexico. Stay tuned.
We decided to focus on medium and heavy truck, (M&HT) production this month as this sector has had only scant recognition in our past reports. Interestingly M&HT production in NAFTA has been a terrific leading indicator of recessions since 1990. Figure 1 has recessions highlighted. It seems that the planners of truck production regularly polish their crystal balls. The lead time between the peak of production and the onset of recession was over a year in 1990, 2001 and 2008. Readers may remember that in 1996 a recession was narrowly avoided and this also shows as a dip in M&HT production. We have been concerned about the shape of the production curve in the last two years but it looks now as though this was just a hesitation.
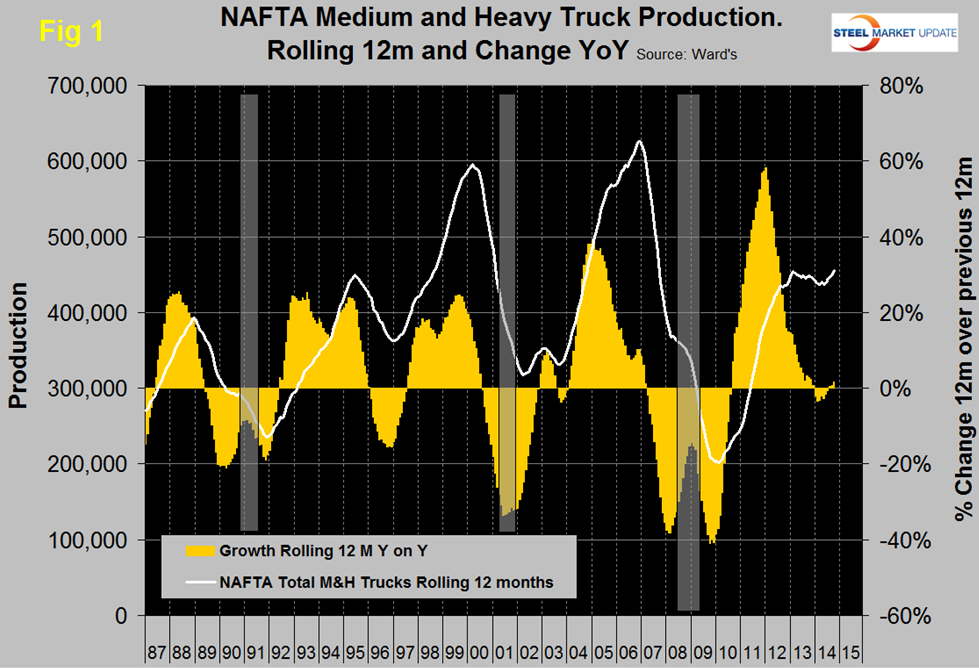
There has been a major shift in M&HT production between the three NAFTA countries in the last four years. Figure 2, Figure 3, and Figure 4 show total production for each nation on a rolling 12 months basis and the year over year growth rate. Note that to achieve true comparability the scales are the same. It can be seen that in 2014 there has been no growth in the US, Canada has had negative growth as has Mexico until this latest month of October.
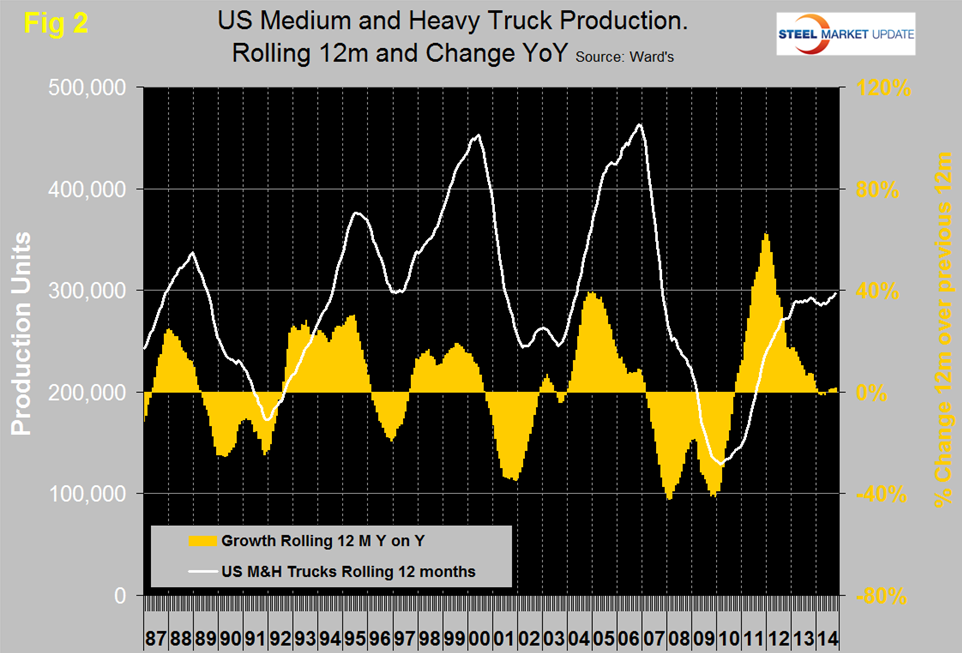
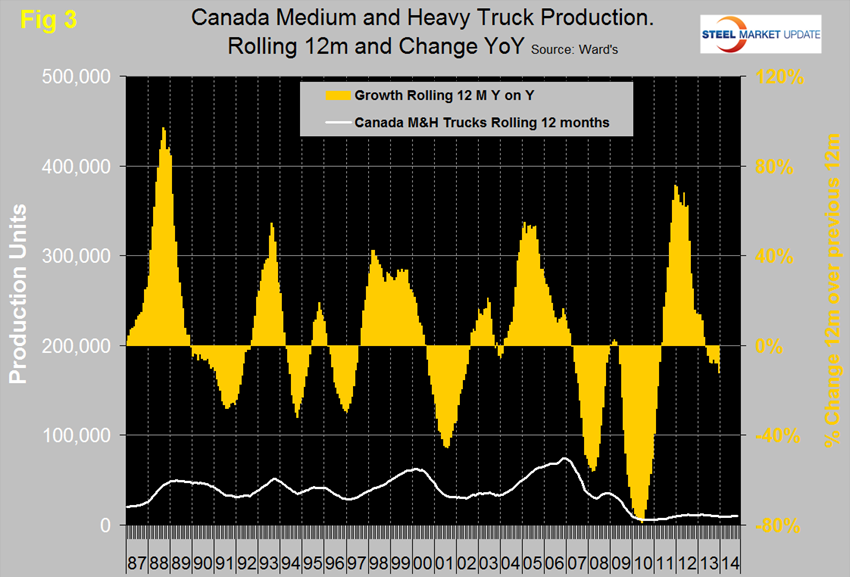
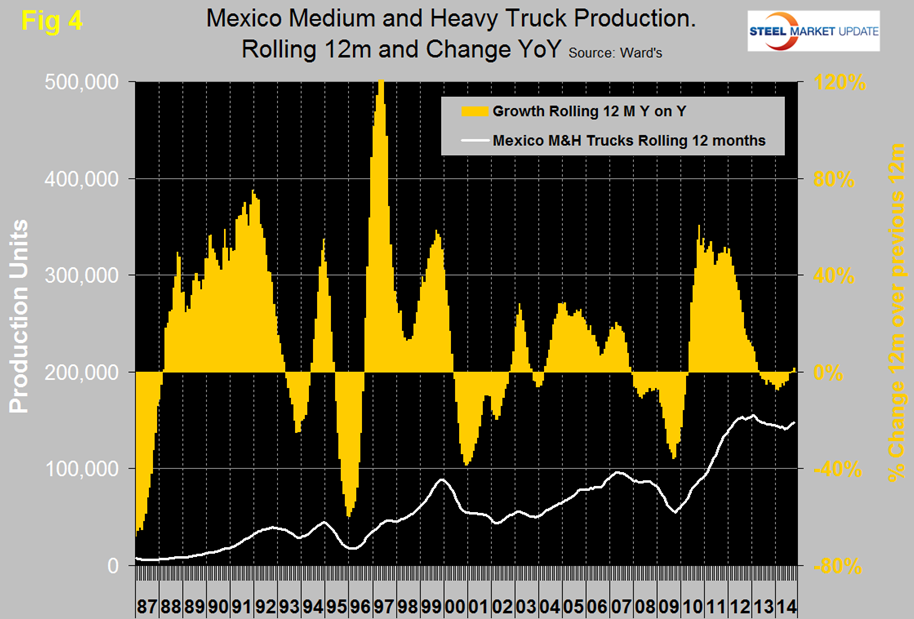
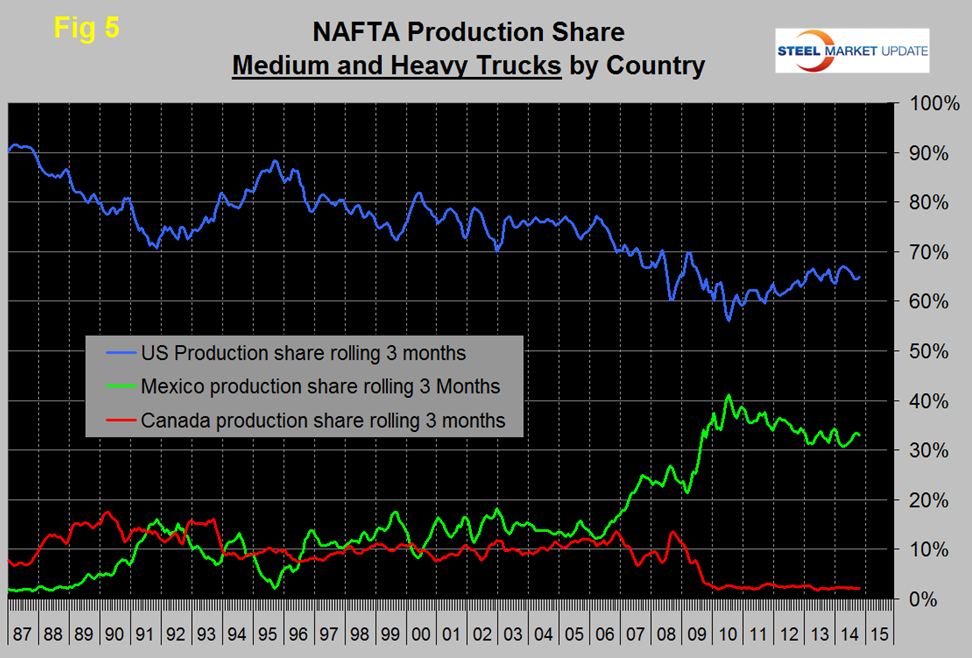
Figure 5 shows the production share of each country since 1987. Between 2006 and mid-2010 Mexico took share from the US and virtually ran Canada out of the business. In Mid-2010 the growth patterns of the US and Mexico reversed and the US has been picking up share ever since. Close examination of Figure 5 shows that over the short run the changes between the US and Mexico are mirror images of each other. When one goes down the other goes up meaning that the auto companies are routinely shifting production, presumably because of local short term considerations. In 2014, total NAFTA production of M&HT trucks has ranged from 34,931 units in February to 45,436 in October, US production was 29,464 units in October. Sales of these vehicles in the US were, 22,874 units in October meaning that the US has a healthy trade surplus in this product. Something we mean to investigate in the future.