

Prices

December 20, 2014
Oil and Gas Prices and Rotary Rig Counts in December 2014
Written by Peter Wright
Figure 1 shows historical gas and oil prices since January 2000. The daily spot price of West Texas Intermediate fell below $100 in August and by December 15th was down to $55.96, the latest daily figure available from the Energy Information Administration, (EIA.) Brent closed at $61.09 on the same day. Natural gas delivered to the Henry Hub in Louisiana fell below $4.00 in August and on December 15th stood at $3.66 per million BTUs.
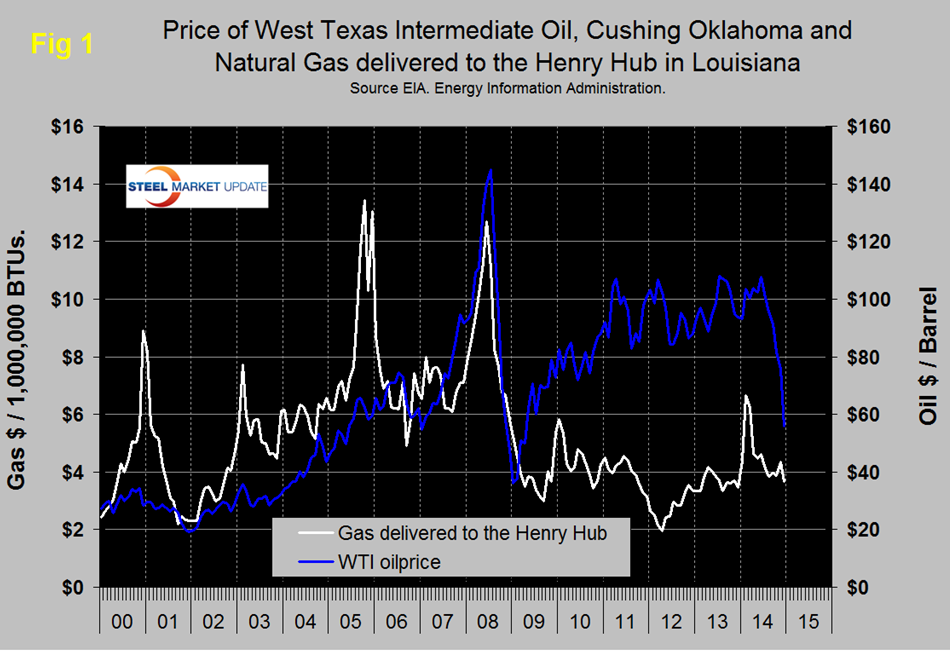
Figure 2 shows the Baker Hughes North American Rotary Rig Count which is a weekly census of the number of drilling rigs actively exploring for or developing oil or natural gas in the United States and Canada. Rigs are considered active from the time they break ground until the time they reach their target depth and may be establishing a new well or sidetracking an existing one. The Baker Hughes Rotary Rig count includes only those rigs that are significant consumers of oilfield services and supplies. Fig 2 shows that the oil rig count which had been trending flat for almost two years, accelerate in 2014 until October 10th when it reached 1,609 and has since declined to 1,536 no doubt in response to the declining oil price. The gas rig count is down year over year, has improved slightly in the last nine months and now stands at 338 a level not seen since the mid-90s.
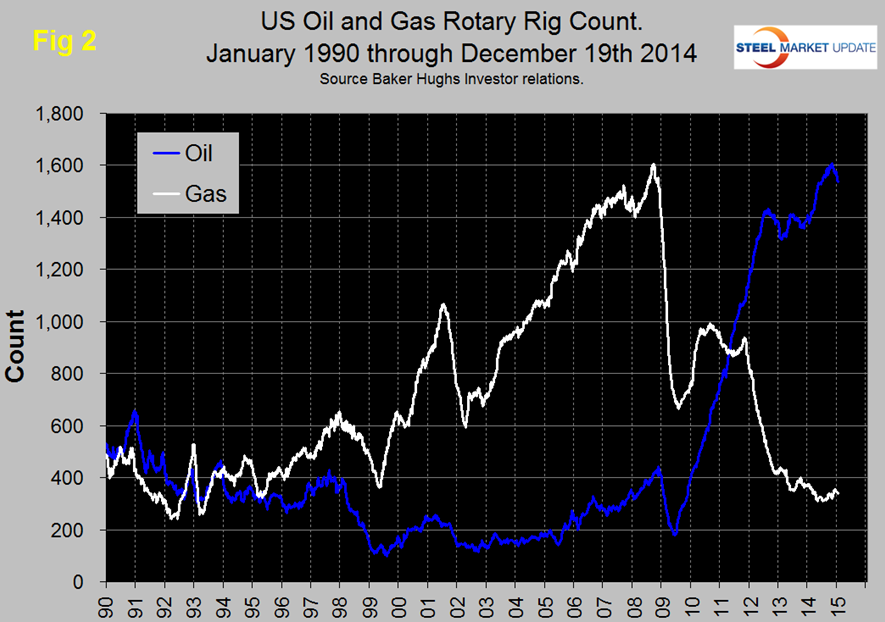
The total number of operating rigs is now 1,875 a decrease of 54 in the last month. Land rigs decreased by 59 to 1,817 and off shore increased by 5 to 58. On a regional basis the big three states for operating rigs are Texas at 876, down by 38 in the last month, Oklahoma at 205, down 9 and North Dakota at 172, down 5. On November 27, OPEC ministers got together and stood firm on cutting production. Within a few hours, crude futures collapsed over $5 and settled around $69 per barrel at the end of that day. Now producers must take a hard look at their capital expenditure in the next 24 months and make the decision that if they want a healthy market with reasonable returns, they must cut production. Armada Executive Intelligence expects to see a more serious view of this going forward and more firms announcing a cut to their capital expenditure of 60 percent to 70 percent. During the closed-door OPEC meetings in Viennaon Thanksgiving day, Saudi oil minister Ali al-Naimi told OPEC members that OPEC had to combat the US fracking boom. If OPEC cut output to raise the price of oil, it would lose market share, he argued. The way to win would be to allow overproduction to depress prices to the point where they would destroy the profitability of North American producers. And they’d have to cut production, rather than OPEC. With Saudi Arabia’s overwhelming power within OPEC, his argument won against objections from desperate members, such as Venezuela, Iran, and Algeria, which wanted a production cut to push prices back up.
SMU’s view is that the extraordinary changes presently taking place in the global energy markets will impact future steel demand. The decline in global oil prices will reduce the incentive to invest in non-traditional exploration and the market trends for natural gas will eventually result in higher prices and a virtuous spiral in production as supply stimulates demand from such industries as power generation and direct reduced iron among many others. Recognizing the magnitude of current global forces we have included an article here by Jawad Mian and published by Mauldin Economics on November 27, 2014 that we think does a good job of summarizing some of the major geo-political influences and actions being planned for global energy production and distribution. The issue of energy prices has considerable implications for steel demand. Not all bad. Ford’s bet on the aluminum intensive F150 will not look so good with gasoline at $2.00 per gallon.


