

Analysis

January 6, 2015
CPIP Data & Analysis
Written by Peter Wright
Each month the Commerce Department issues its construction put in place (CPIP) data, usually on the first working day covering activity two months earlier. November data was released on January 2nd. Construction put in place is based on spending work as it occurs, estimated for a given month from a sample of projects. In effect the value of a project is spread out from the project’s start to its completion. Construction starts data published by the Commerce Department for residential construction and by McGraw Hill/Dodge and Reed Construction for non-residential is completely different as in these cases the whole project is entered to the data base when ground is broken. The official CPIP press report gives no appreciation of trends on a historical basis and merely compares the current month with the previous one on a seasonally adjusted basis. The detail is hidden in the published data tables which we at SMU compile to provide a long term perspective. Our intent is to provide a rout map for those subscribers who are dependent on this industry to “Follow the money.” This is a very broad and complex subject therefore to make this monthly write up more comprehensible we are keeping the information format as consistent as possible.
Total Construction: Data is reported on both a seasonally adjusted and non-adjusted basis. In the SMU analysis we consider only the non-seasonally adjusted data and remove seasonality by the consideration of year over year (y/y) data. We also focus on rolling 3 and 12 months to remove the noise in single month numbers. Please note that the official news release from the Commerce Department which we include below may at first glance seem to conflict with the SMU analyses. This is because the government commentary is based on seasonally adjusted numbers.
November expenditures were $82.651 billion which breaks down to $59.684 B of private work, $21.137 B of state and locally (S&L) funded work and $1.830 B of federally funded, (Table 1).
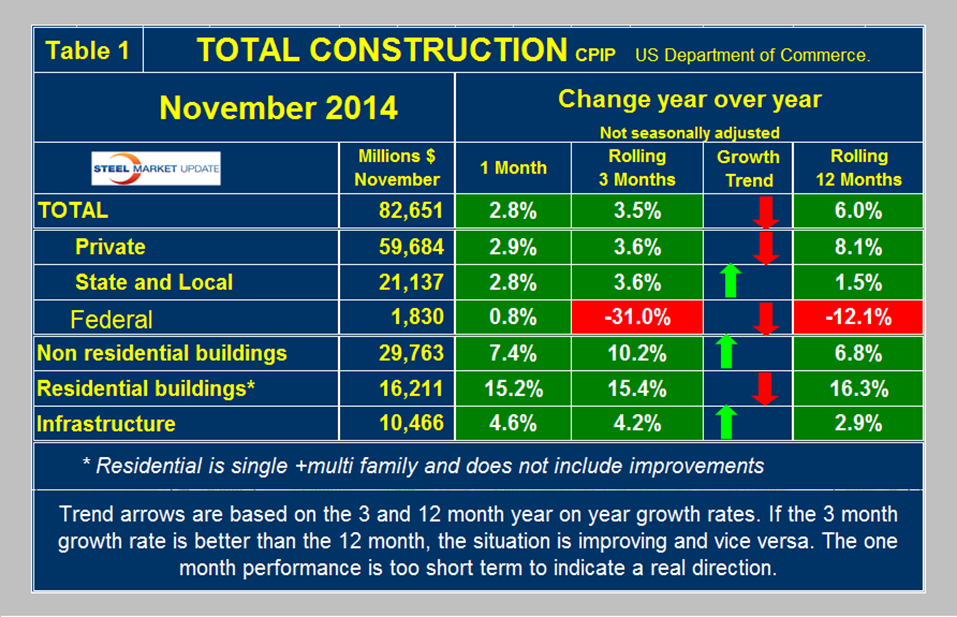
On a rolling three month basis total construction was up by 3.5 percent y/y, an improvement from 2.8 percent in our last report. On a rolling 12 month basis y/y total construction was up by 6.0 percent, a decline from 6.3 percent in October. This means that total construction growth is decelerating since the short term growth (3 months 3.5 percent) is less than the long term, (12 months 6.0 percent). We report this as negative momentum. Note this is not a seasonal effect because our y/y analysis removes seasonality. Private work had negative momentum in November but state and local momentum was positive, both trends the same as they were each month from June through October. Federally funded construction continues to contract rapidly being down by 31.0 percent on a rolling three months year over year basis. In every month so far in 2014 the rolling three months Federal construction expenditures have been >30 percent less than the same period a year earlier. We consider three sectors within total construction. These are non-residential, residential and infrastructure. On a rolling three month basis y/y non-residential is growing at 10.2 percent and accelerating. Residential is growing at 15.4 percent and slowing. Infrastructure grew 4.2 percent y/y and accelerated in the last three months with positive momentum. The growth of total construction improved from December through June but has been slowing since June as shown by the brown bars in Figure 1. The trajectory of total annual expenditures has flattened as shown by the blue line which, if this trend continues will push our projection of recovery to the pre-recession peak out several years.
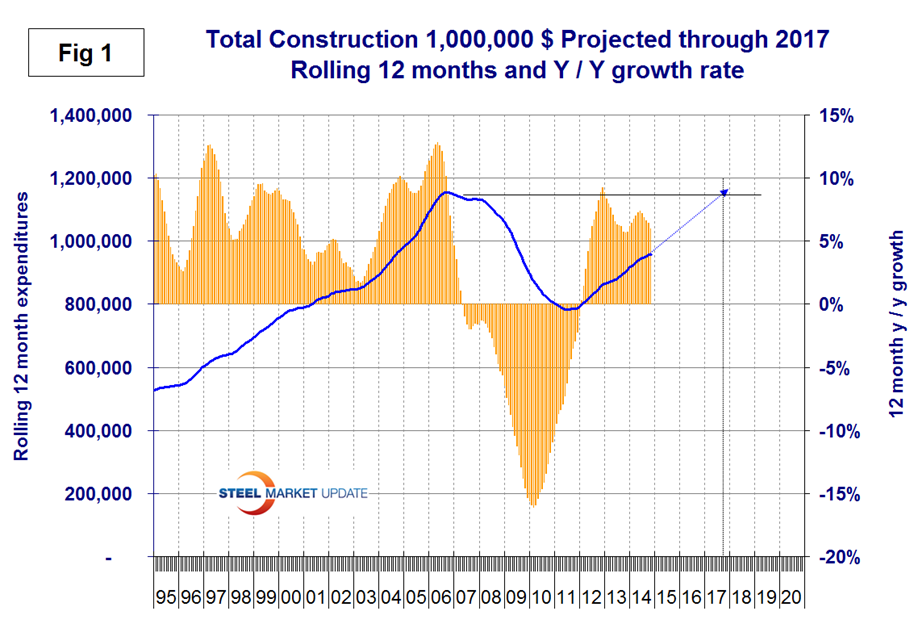
The pre-recession peak of total construction on a rolling 12 month basis was $1,145 B in 12 months through February 2007. The low point was $768 B in 12 months through May 2011. The 12 month total through the latest data of November 2014 was $958.482 B.
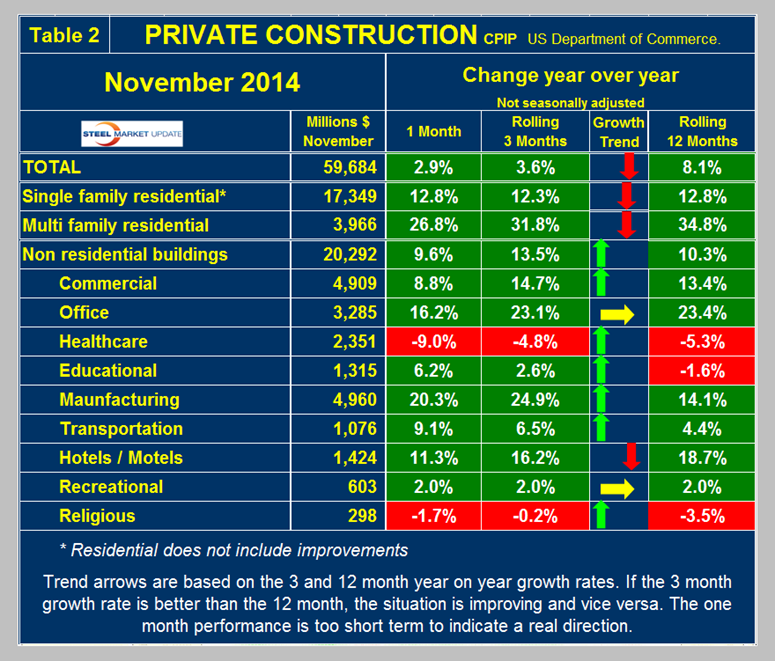
Private Construction: In the November CPIP data, private work decelerated significantly from a 8.1 percent growth rate in 12 months y/y to a 3.6 percent rate in 3 months y/y, (Table 2).
This was the third consecutive month for the 12 month growth to fall below 10 percent as shown by the brown bars in Figure 2 and follows 26 straight months of double digit growth. We had been projecting a full recovery of private construction sometime in 2017 but this is slipping.
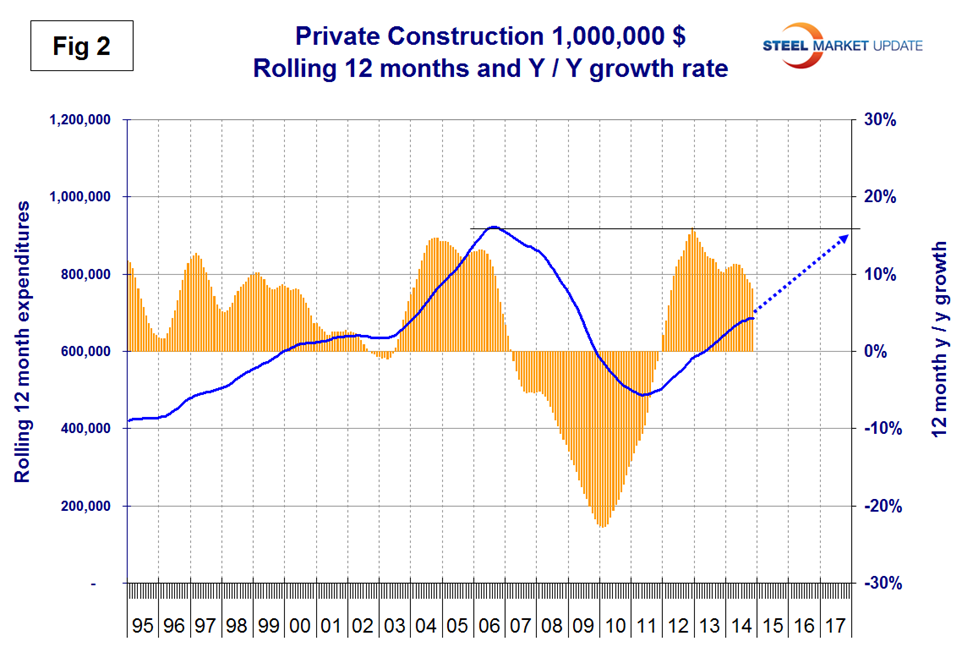
Table 2 breaks down the private sector into project types. Residential buildings, both single and multi-family still have strong y/y growth but both have negative momentum. The single family data coincides reasonably well with the housing starts data from the Census Bureau which has single family growing at an 8.5 percent rate but in this CPIP report multi family is growing at 31.4 percent as the multifamily housing starts data shows a collapse to 3.1 percent. Note: the housing data is starts in which the total project cost is entered in a single month. This suggests that the CPIP data for multifamily will also decline strongly in 2015. Private non-residential buildings grew at a 13.5 percent rate in three months through November y/y with a positive momentum. Within private non-residential, only health care and religious buildings had negative growth. Offices, manufacturing, hotels / motels and commercial continued to have strong year over year growth in three months through November. Private educational buildings have turned around and achieved positive growth after 13 consecutive months of contraction.
State and Local Construction: S&L work expanded by 3.6 percent in the rolling three months through November y/y. (Table 3).
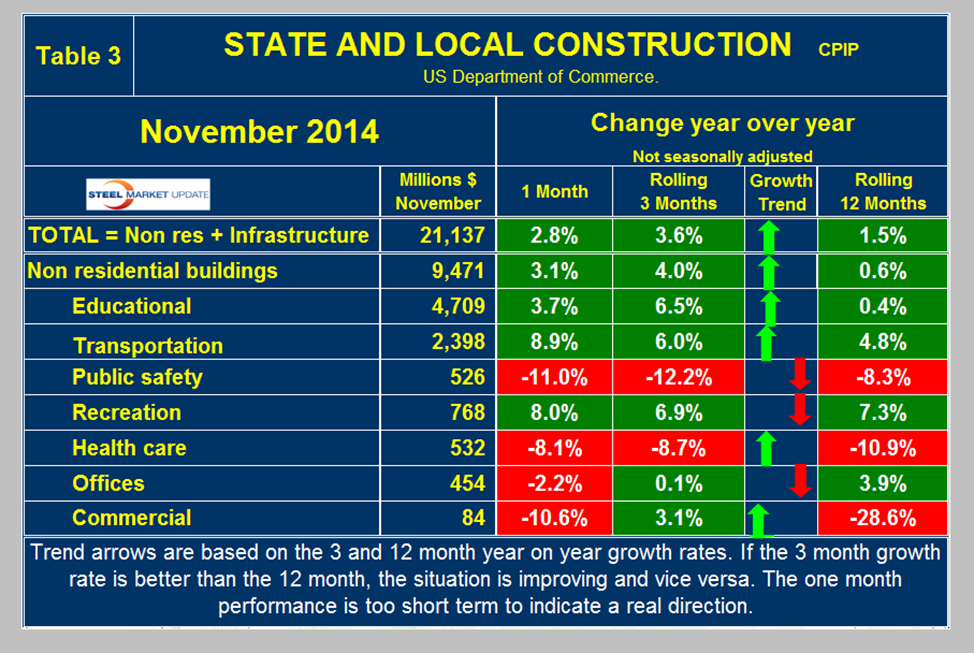
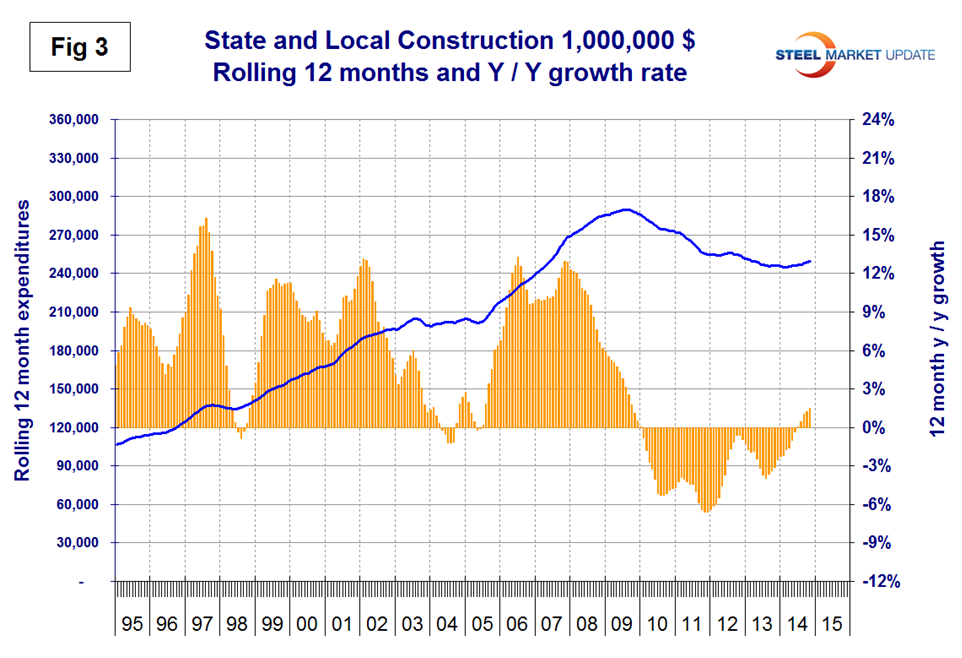
This was the seventh consecutive month of positive y/y growth on a rolling three months basis, the first time that has happened in four years and momentum is positive as indicated by the three month growth rate being higher than the twelve month. Figure 3 which is on a rolling 12 months basis shows four consecutive months of positive growth after 54 months of contraction.
S&L non-residential building grew by 4.0 percent in three months through November y/y, and momentum continues to be positive. It looks as though state and local governments are beginning to loosen the purse strings as far as construction is concerned. Educational buildings are about 75 percent funded by state and local governments and are by far the largest sub sector of S&L non-residential at almost $4.7 billion in November. State and locally funded educational building construction expanded by 6.5 percent in three months through November, the best performance in 65 months. Recreational buildings have accelerated markedly in the last four months and grew by 6.9 percent in the latest data making this the strongest sector within State and Local. Transportation terminals continue to do well. Public safety buildings which includes jails, police and fire stations have had negative growth for 24 straight months on a rolling 3 months basis y/y. Comparing Figures two and three it can be seen that S&L construction did not decline proportionately as much as private work during the recession. Many state and local governments are still far from healthy, as increased revenues have been more than offset by increased future obligations, including the need to replenish reserve and rainy-day funds and to service defined benefit liabilities, pensions and Medicaid foremost. In spite of these limitations S&L construction seems to have bottomed out and begun what will be a very long period of recovery to pre-recession levels.
Drilling down into the private and S&L sectors as presented in Tables 2 and 3 shows which project types should be targeted for steel sales and which should be avoided. There are some project types within S&L that are doing quite well but there are also major regional differences to be considered.
Infrastructure: Expenditures have had positive growth in each of the last fifteen months through November on a rolling 3 months basis with a + 4.2 percent result in the latest data. The growth in three months is stronger than that in 12 months meaning that momentum is positive and presumably is a result of the temporary resolution of highway trust fund issue. Highway and streets including pavement and bridges accounts for about 2/3 of total infrastructure expenditures and has had positive growth for the last twelve months, (Table 4).
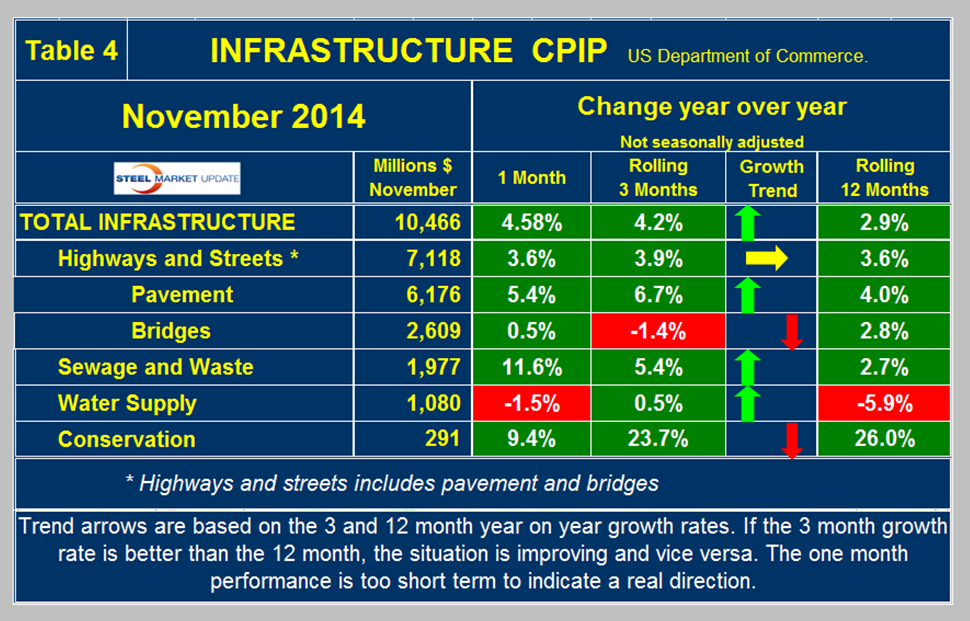
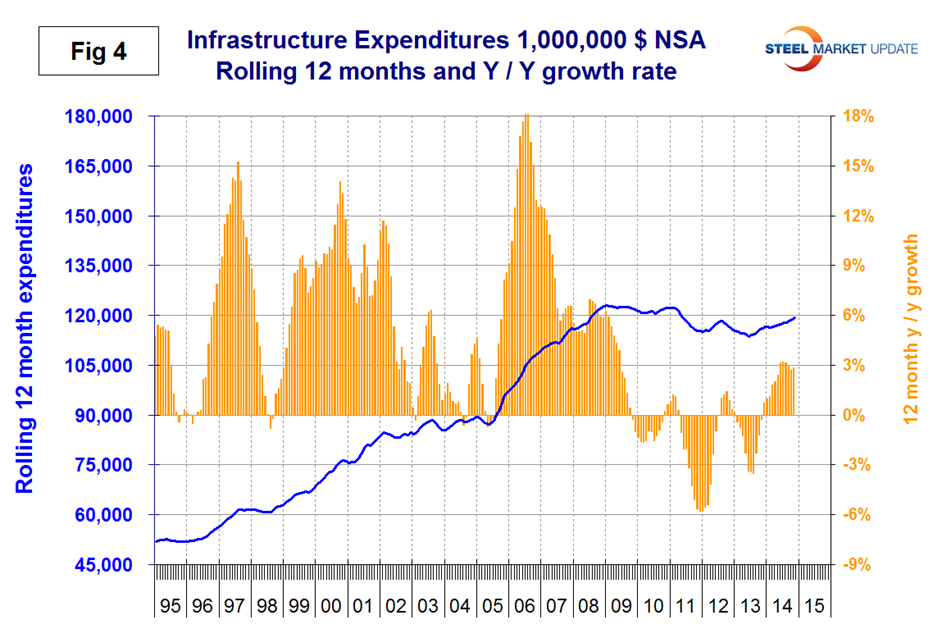
Highway pavement is the main sub-component of highways and streets and it has had positive growth for the last seven months. Bridge work declined in October and November after 15 straight months of growth but is still 21.4 percent higher than the pre-recession level. Pavement on the other hand is 14.8 percent below the pre-recession level. Water supply was up slightly in three months through November after 10 months of decline. There has been a surge in conservation expenditures this year but the outlays are relatively small. On a rolling 12 month basis, infrastructure expenditures are about where they were four years ago, the growth rate has slowed since mid-year. (Figure 4).
The press release from the Commerce Department on Friday reads as follows:
November 2014 Construction at $975.0 Billion Annual Rate
The U.S. Census Bureau of the Department of Commerce announced today that construction spending during November 2014 was estimated at a seasonally adjusted annual rate of $975.0 billion, 0.3 percent below the revised October estimate of $977.7 billion. The November figure is 2.4 percent above the November 2013 estimate of $952.5 billion. During the first 11 months of this year, construction spending amounted to $884.6 billion, 5.7 percent above the $836.9 billion for the same period in 2013.
Private Construction Spending on private construction was at a seasonally adjusted annual rate of $697.7 billion, 0.3 percent above the revised October estimate of $695.7 billion. Residential construction was at a seasonally adjusted annual rate of $352.7 billion in November, 0.9 percent above the revised October estimate of $349.6 billion. Nonresidential construction was at a seasonally adjusted annual rate of $345.0 billion in November, 0.3 percent below the revised October estimate of $346.1 billion.
Public Construction In November, the estimated seasonally adjusted annual rate of public construction spending was $277.3 billion, 1.7 percent below the revised October estimate of $282.0 billion. Educational construction was at a seasonally adjusted annual rate of $62.1 billion, 2.5 percent below the revised October estimate of $63.8 billion. Highway construction was at a seasonally adjusted annual rate of $85.7 billion, 0.3 percent above the revised October estimate of $85.4 billion.
December 2014 data will be released on February 2, 2015 at 10:00 A.M. EST.


