Analysis

February 3, 2015
Construction Expenditures Through December 2014
Written by Peter Wright
The following article is normally produced just for our Premium level members. We are sharing the information today with all of our readers. The article is written by Peter Wright, consultant to Steel Market Update, Gerdau and the State of Wyoming. Peter, who is a metallurgist as well as market specialist, is also one of our Steel 101 instructors. Our next program will be in the Chicago area on May 19 & 20th and will include a tour of the NLMK Indiana steel mill.
Each month the Commerce Department issues its construction put in place (CPIP) data, usually on the first working day covering activity two months earlier. December data was released on February 2nd. Construction put in place is based on spending work as it occurs, estimated for a given month from a sample of projects. In effect the value of a project is spread out from the project’s start to its completion.
Construction starts data published by the Commerce Department for residential construction and by McGraw Hill / Dodge and Reed Construction for non-residential is completely different as, in these cases, the whole project is entered to the data base when ground is broken. The official CPIP press report gives no appreciation of trends on a historical basis and merely compares the current month with the previous one on a seasonally adjusted basis. The detail is hidden in the published data tables which we at SMU compile to provide a long term perspective. Our intent is to provide a route map for those subscribers who are dependent on this industry to “Follow the money.” This is a very broad and complex subject therefore to make this monthly write up more comprehensible we are keeping the information format as consistent as possible.
Total Construction: Data is reported on both a seasonally adjusted and non-adjusted basis. In the SMU analysis we consider only the non-seasonally adjusted data and remove seasonality by the consideration of year over year (y/y) data. We also focus on rolling 3 and 12 months to remove the noise in single month numbers. Please note that the official news release from the Commerce Department, which we include below, may at first glance seem to conflict with the SMU analyses. This is because the government commentary is based on seasonally adjusted numbers.
November expenditures were $76.366 billion which breaks down to $55.891 B of private work, $18.404 B of state and locally, (S&L) funded work and $2.071 B of federally funded, (Table 1).
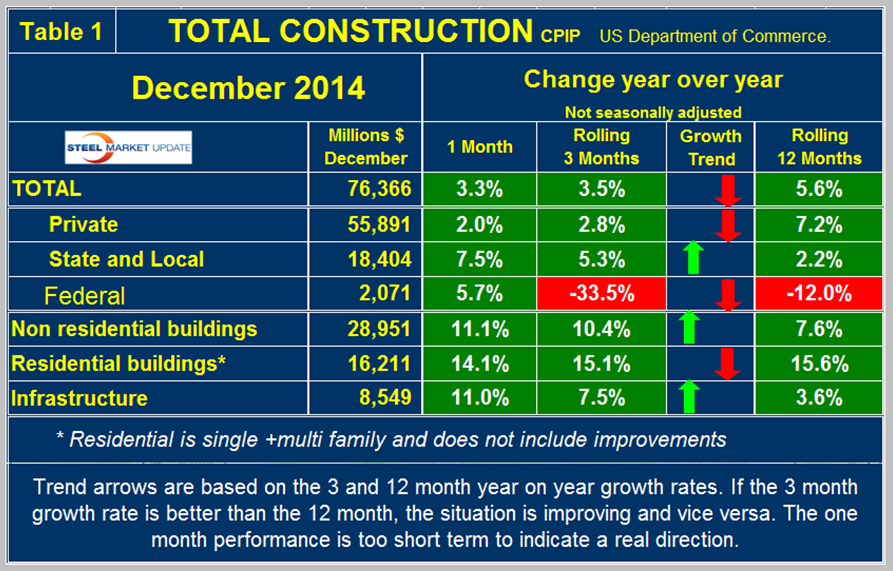
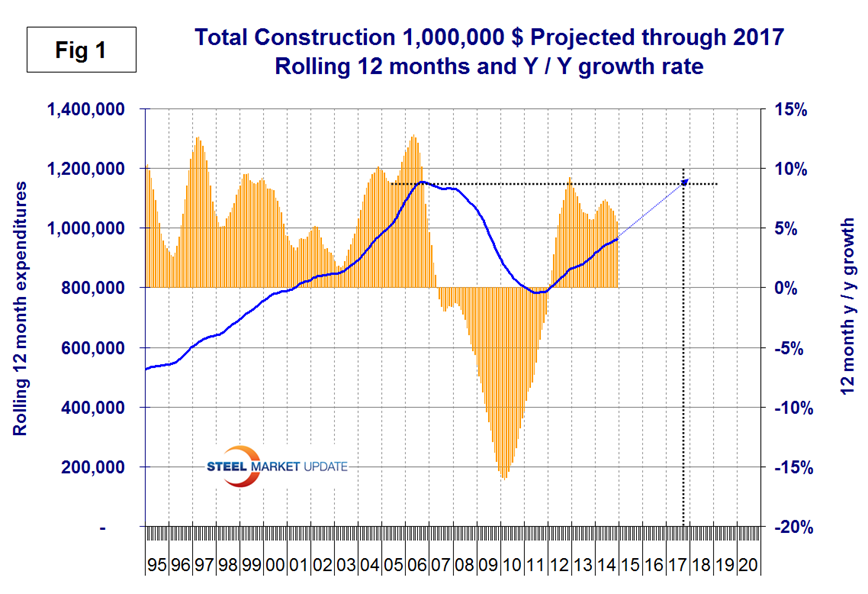
On a rolling three month basis, total construction was up by 3.5 percent y/y, the same as in our last report. On a rolling 12 month basis, y/y total construction was up by 5.6 percent, a decline from 6.0 percent in November. This means that total construction growth is decelerating, since the short term growth (3 months 3.5 percent) is less than the long term, (12 months 5.6 percent). We report this as negative momentum. Note this is not a seasonal effect because our y/y analysis removes seasonality. Private work had negative momentum in November but state and local momentum was positive, both trends the same as they were each month from June through November. Federally funded construction continues to contract rapidly, down by 33.5 percent on a rolling three months year over year basis. In every month of 2014 the rolling three months Federal construction expenditures have been >30 percent less than the same period a year earlier. We consider three sectors within total construction. These are non-residential, residential and infrastructure. On a rolling three month basis, y/y non-residential is growing at 10.4 percent and accelerating. Residential is growing at 15.1 percent and slowing. Infrastructure grew 7.5 percent y/y and accelerated in the last three months with positive momentum. The growth of total construction improved from December through June but has been slowing since June as shown by the brown bars in Figure 1. The trajectory of total annual expenditures has flattened slightly as shown by the blue line but is still on track to reach the pre-recessionary peak by the end of 2017. The pre-recession peak of total construction on a rolling 12 month basis was $1,145 B in 12 months through February 2007. The low point was $768 B in 12 months through May 2011. The 12 month total through the latest data of December 2014 was $961.402 B.
Private Construction: In the December CPIP data, private work decelerated significantly from a 7.2 percent growth rate in 12 months y/y to a 2.8 percent rate in 3 months y/y, (Table 2).
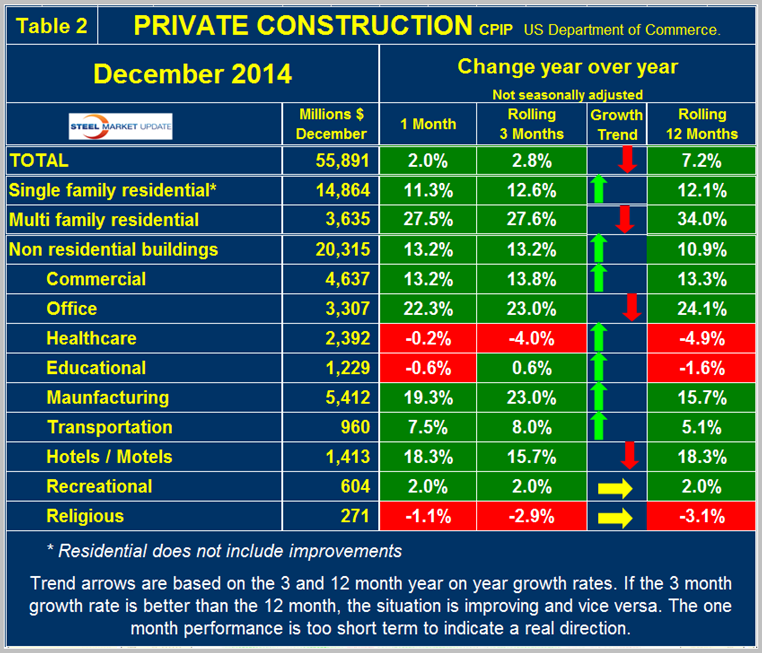
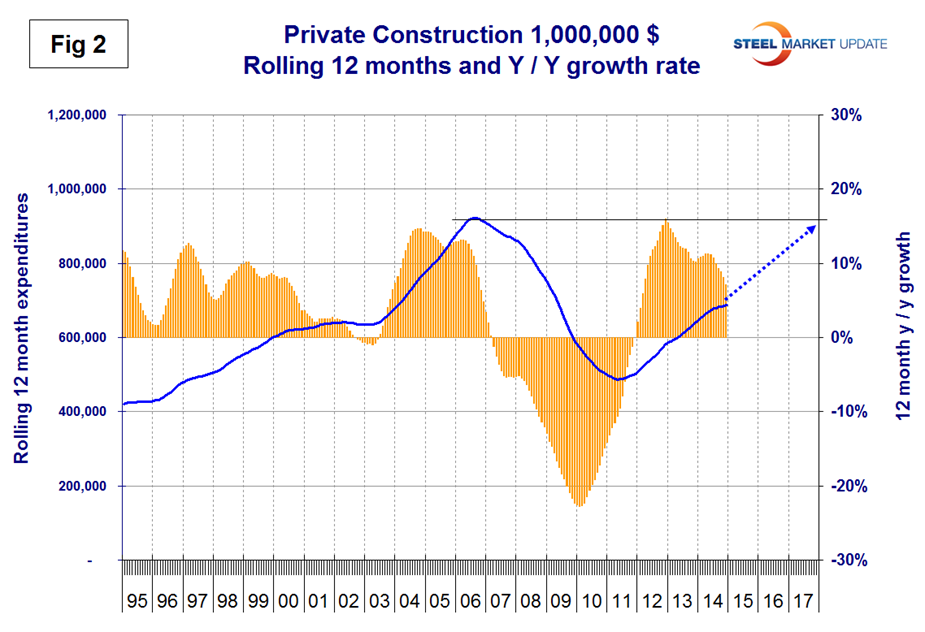
This was the fourth consecutive month for the 12 month growth to fall below 10 percent as shown by the brown bars in Figure 2 and follows 26 straight months of double digit growth. We had been projecting a full recovery of private construction sometime in 2017 but this is slipping. Table 2 breaks down the private sector into project types. Residential buildings, both single and multi-family still have strong y/y growth but the momentum of each is different. Currently single family has a small positive momentum but multi-family is slowing. The single family expenditures reported here have a rate of growth almost twice that of single family starts reported by the Census Bureau which have starts growing at 6.8 percent. The discrepancy in multi-family is much greater. In this CPIP report multi-family is growing at 27.6 percent as the multifamily housing starts data shows a collapse to 1.3 percent. Note: the housing data is starts in which the total project cost is entered in the single month of groundbreaking. This suggests that the CPIP data for multifamily will also decline strongly in 2015. Private non-residential buildings grew at a 13.2 percent rate in three months through December y/y with a positive momentum. Within private non-residential, only health care and religious buildings had negative y/y growth on a rolling three months basis. Offices, manufacturing, hotels/motels and commercial continued to have strong year over year growth in three months through December. In over 10 years since mid-2004, religious buildings have achieved positive growth in only six of those months and in that time period expenditures have declined from $8.6 B on a rolling 12 months basis to $3.5 B in 2014.
State and Local Construction: S&L work expanded by 5.3 percent in the rolling three months through December y/y. (Table 3).
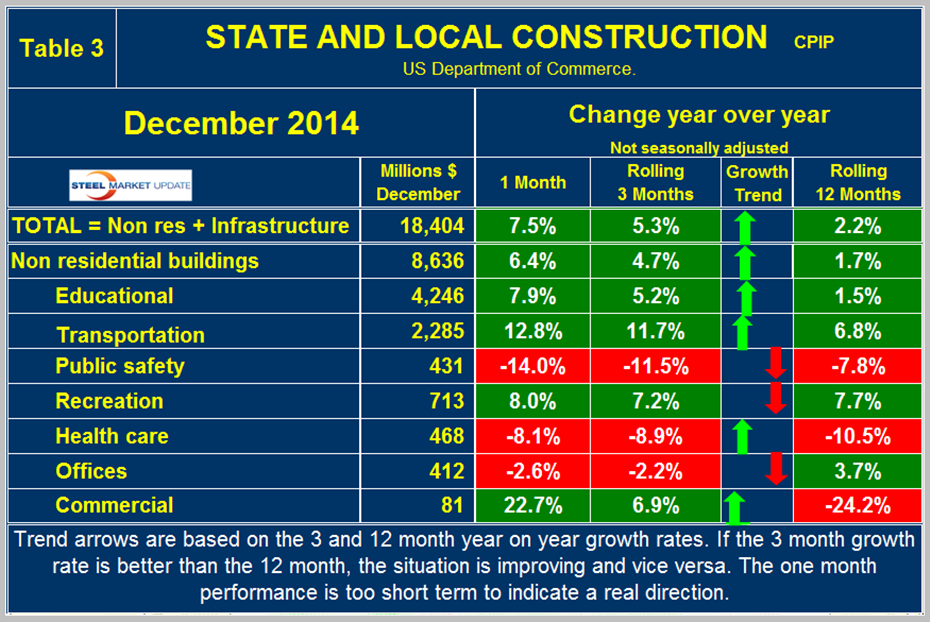
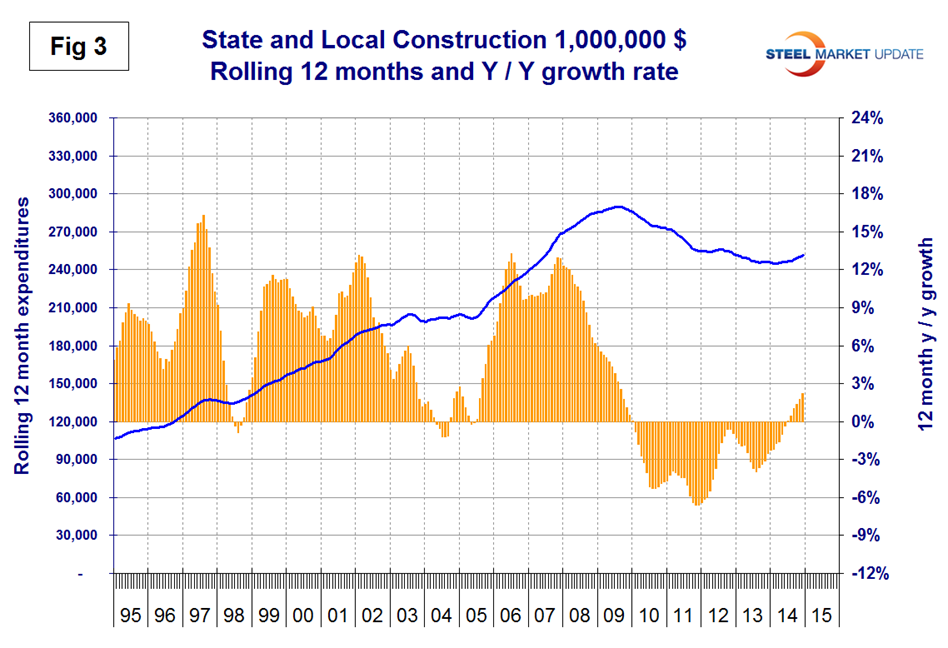
This was the eighth consecutive month of positive y/y growth on a rolling three months basis, the first time that has happened in four years and momentum is positive as indicated by the three month growth rate being higher than the twelve month. Figure 3 which is on a rolling 12 months basis shows five consecutive months of positive growth after 54 months of contraction. S&L non-residential building grew by 4.7 percent in three months through December y/y, and momentum continues to be positive. It looks as though state and local governments are beginning to loosen the purse strings as far as construction is concerned. Educational buildings are about 75 percent funded by state and local governments and are by far the largest sub sector of S&L non-residential at $4.2 billion in December. State and locally funded educational building construction expanded by 5.2 percent in three months through December, the second best month after November in 65 months. Recreational buildings have accelerated markedly in the last five months and grew by 7.2 percent in the latest data. Transportation terminals continue to do well with double digit y/y growth in the 4th quarter. Public safety buildings which includes jails, police and fire stations have had negative growth for 25 straight months on a rolling 3 months basis y/y. Comparing Figures two and three, it can be seen that S&L construction did not decline proportionately as much as private work during the recession. Many state and local governments are still far from healthy, as increased revenues have been more than offset by increased future obligations, including the need to replenish reserve and rainy-day funds and to service defined benefit liabilities, pensions and Medicaid foremost. In spite of these limitations S&L construction seems to have bottomed out and begun what will be a very long period of recovery to pre-recession levels.
Drilling down into the private and S&L sectors as presented in Table 2 and Table 3 shows which project types should be targeted for steel sales and which should be avoided. There are some project types within S&L that are doing quite well but there are also major regional differences to be considered.
Infrastructure: Expenditures have had positive growth in each of the last sixteen months through December on a rolling 3 months basis with a + 7.5 percent result in the latest data. The growth in three months is stronger than that in 12 months meaning that momentum is positive and presumably is a result of the temporary resolution of highway trust fund issue. Highway and streets including pavement and bridges accounts for about 2/3 of total infrastructure expenditures and has had positive growth for the last thirteen months, (Table 4).
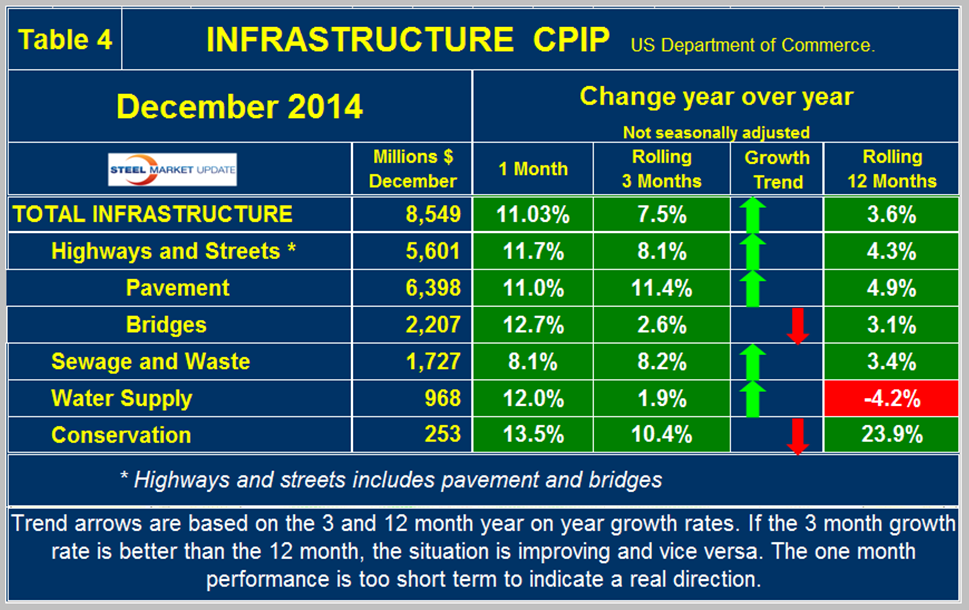
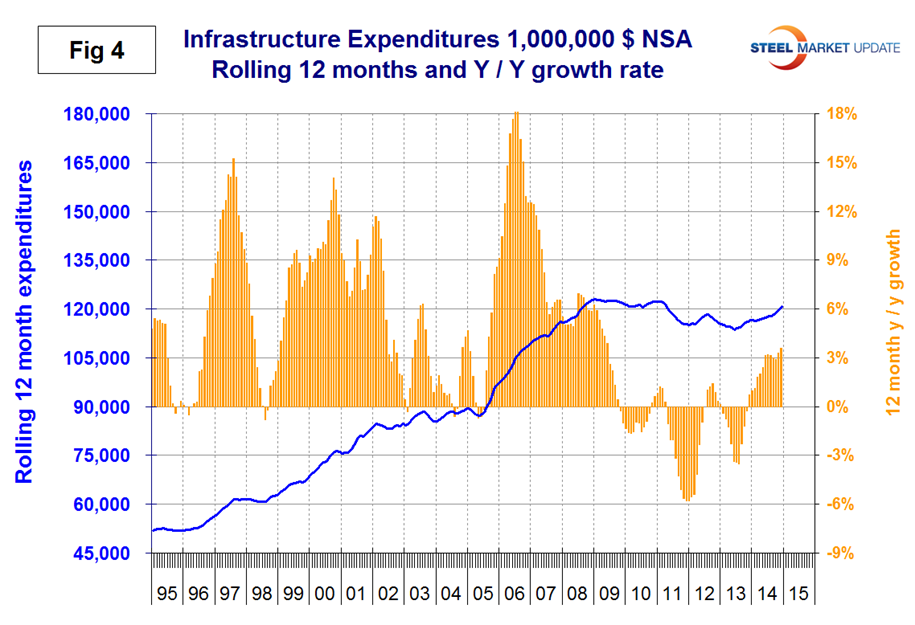
Highway pavement is the main sub-component of highways and streets and it has had positive growth for the last eight months. Bridge work has expanded for the last eight months y/y and totaled 8.6 billion in December. In 2014, total expenditures on bridges was $29.5 billion which was over three times the expenditures in 2000. This doesn’t seem to support the much publicized view of the proportion of unsafe bridges in the country. Water supply was up slightly in December and November after 10 months of decline. There has been a surge in conservation expenditures this year but the outlays are relatively small. On a rolling 12 month basis, infrastructure expenditures are about where they were four years ago, and have expanded throughout 2014. (Figure 4).
Dodge Data & Analytics reported as follows last month: “Lower oil prices and their negative effect on production will have a direct impact on two construction sectors—the manufacturing category’s outdoor chemical plants and the public works category of pipelines (both are measured solely in dollar value, not square footage). Outdoor chemical plants include construction for oil refineries and other energy-related production facilities, which have seen considerable increases in activity during recent years. In fact, Dodge Data & Analytics reports that the dollar value of manufacturing starts reached an all-time high of $29 billion in 2014, largely on investment in energy-related facilities. Pipelines fall into a larger catch-all category, but one that has also reached new heights in recent years due to its energy-related components. If sustained, however, the decline in oil prices is likely to dampen enthusiasm for new capital investment within these categories. As a consequence, both sectors could drop precipitously if prices remain low. Other types of construction, however, could profit marginally from a sustained drop in oil prices. Commercial construction, which is closely tied to overall economic growth, would likely be the prime beneficiary of higher consumer spending, particularly retail and hotel construction. All commercial projects that are financed partially through debt, however, are likely to be rewarded by lower interest rates that make potential returns on investment more attractive for developers. Institutional building and public works, which are largely funded through the public sector, would see a less direct impact. At the national level, these sectors could see an ancillary effect from the stronger economy as that strength is reflected in higher tax receipts and other government revenue. The nation’s housing market could also see a net positive thanks to both wealthier-feeling consumers and mortgage rates that remain lower for longer than previously expected. Ultimately, these factors should encourage more buyers into the market boosting home sales and housing starts.
Geography, notably the impact from big oil-producing states, could play the ultimate role in determining whether a sustained decline in oil prices would be a net positive or negative on construction activity. Refinery expansion and the total dollar value of manufacturing starts have been concentrated in Texas, Louisiana, Nevada, and, to a smaller extent, Oklahoma. The dollar value of manufacturing construction in these states reached $22 billion in 2014—68 percent of the U.S. total. Texas alone accounted for 48 percent of the U.S. dollar value of manufacturing construction in 2014. Therefore, if the oil industry significantly reduces capital investment because of low prices, it could have a large enough effect to reduce the dollar value of total U.S. manufacturing starts.”
Two-Thirds of the Economic Benefits and Jobs Created By Road & Transit Investment Occur in Non-Construction Sectors, New Study Finds
Washington, D.C.—Two-thirds of the economic benefits and jobs created by federal highway and transit investment occur in non-construction sectors, according to a new analysis from IHS Inc. (NYSE: IHS), a leading global source of critical information and insight. The study also finds that every dollar invested through the federal Highway Trust Fund (HTF) in state highway, bridge and public transit infrastructure programs returns 74 cents in tax revenue.
The report, “Transportation Infrastructure Investment: Macroeconomic and Industry Contribution of Federal Highway and Mass Transit Program,” reveals that 70 percent of the economic benefits, or value-added, of federal HTF investments in transportation improvements occur in non-construction sectors of the economy. Among the sectors that benefit the most are service industries such as business, education, health and leisure, and hospitality.
The study also finds that 62 percent of the jobs created from federal highway and mass transit investments are outside the construction industry. Over one-third of all jobs created are also in service industries like business, education, health and leisure, and hospitality.
“The study shows that investment in transportation infrastructure has a positive impact on every major sector of the U.S. economy. These far reaching economic benefits contribute to economic growth by improving the nation’s capital stock, which enables increased economic activity,” said Karen Campbell, a senior consultant at IHS, who produced the report with Bob Brodesky, a transportation expert and senior manager in the IHS Industry Consulting Group.
Current federal highway and public transit investment, which is about $50 billion annually, generates an average $31 billion in personal income tax receipts per year and $6 billion in federal corporate tax receipts per year due to increased economic activity, according to the analysis. This amounts to 74 cents returned on every dollar invested.
IHS notes that current levels of federal investment on highway and public transit spending contribute nearly one percent to the U.S Gross Domestic Product (GDP), the measure of goods and services produced by the economy. Among the other economic benefits:
• Every $1 in federal highway and mass transit investment increases the nation’s GDP between $1.80 and -$2.00
• Current federal transportation spending contributes on average $410 to real income per household each year.
IHS also studied the resulting impacts from five percent annual increases in federal highway and transit investment from 2014-2019, and found the added investment would create:
• Between 78,000 and 122,000 new jobs by 2019 (includes direct, indirect, and induced jobs);
• An annual average increase of $40 in real household income each year;
• An additional $9.6 billion in real GDP for the U.S. economy by 2019; and
• On average an additional $4.9 billion per year in federal, state and local government revenue.
“Federal transportation spending expands the capital stock of the U.S. economy, drives the production and delivery of goods and services, and positively affects business and household incomes,” the study’s authors write. “It also enhances the transportation system’s operational capacity by reducing travel times and costs. This results in greater accessibility for individuals, households and businesses, more efficient delivery of goods and services, improved lifestyles, and standards of living, and safer roadways.”
The members of the Transportation Construction Coalition (TCC), which commissioned the study, said they would send it to all congressional offices to help them better understand the urgency for a permanent solution for the Highway Trust Fund well before May 2015, when funding for the highway and transit program will once again be in jeopardy for the sixth time since 2008. The TCC is issuing this report ahead of the upcoming congressional recess, when many coalition members will be meeting with their elected officials at home.
For a copy of the IHS report, Transportation Infrastructure Investment: Macroeconomic and Industry Contribution of Federal Highway and Mass Transit Program, go to www.transportationconstructioncoalition.org.
The press release from the Commerce Department on Monday reads as follows:
December 2014 Construction at $982.1 Billion Annual Rate
The U.S. Census Bureau of the Department of Commerce announced today that construction spending during December 2014 was estimated at a seasonally adjusted annual rate of $982.1 billion, 0.4 percent above the revised November estimate of $978.6 billion. The December figure is 2.2 percent above the December 2013 estimate of $961.2 billion. The value of construction in 2014 was $961.4 billion, 5.6 percent above the $910.8 billion spent in 2013.
Private Construction
Spending on private construction was at a seasonally adjusted annual rate of $698.6 billion, 0.1 percent above the revised November estimate of $698.2 billion. Residential construction was at a seasonally adjusted annual rate of $349.6 billion in December, 0.3 percent above the revised November estimate of $348.4 billion. Nonresidential construction was at a seasonally adjusted annual rate of $349.0 billion in December, 0.2 percent below the revised November estimate of $349.8 billion.
The value of private construction in 2014 was $687.0 billion, 7.2 percent above the $641.1 billion spent in 2013. Residential construction in 2014 was $350.0 billion, 4.1 percent above the 2013 figure of $336.2 billion and nonresidential construction was $337.0 billion, 10.5 percent above the $304.9 billion in 2013.
Public Construction
In December, the estimated seasonally adjusted annual rate of public construction spending was $283.5 billion, 1.1 percent above the revised November estimate of $280.4 billion. Educational construction was at a seasonally adjusted annual rate of $61.5 billion, 0.6 percent below the revised November estimate of $61.8 billion. Highway construction was at a seasonally adjusted annual rate of $90.3 billion, 2.1 percent above the revised November estimate of $88.4 billion.
The value of public construction in 2014 was $274.4 billion, 1.8 percent above the $269.6 billion spent in 2013. Educational construction in 2014 was $62.0 billion, 1.2 percent above the 2013 figure of $61.3 billion and highway construction was $84.4 billion, 4.1 percent above the $81.1 billion in 2013.
January 2015 data will be released on March 2, 2015 at 10:00 A.M. EST.