Market Data

May 1, 2015
Regional Job Creation - Q1 2015
Written by Peter Wright
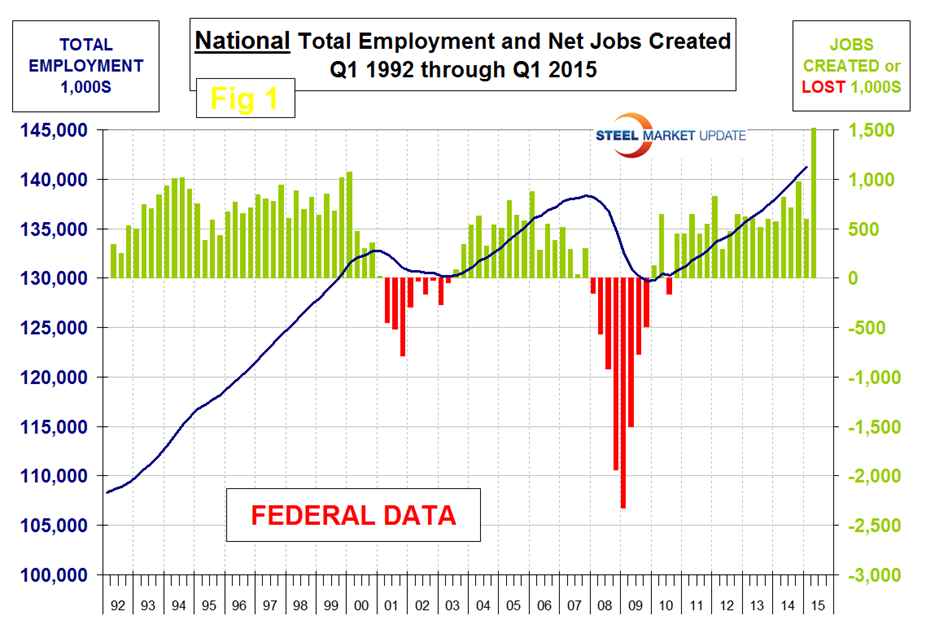
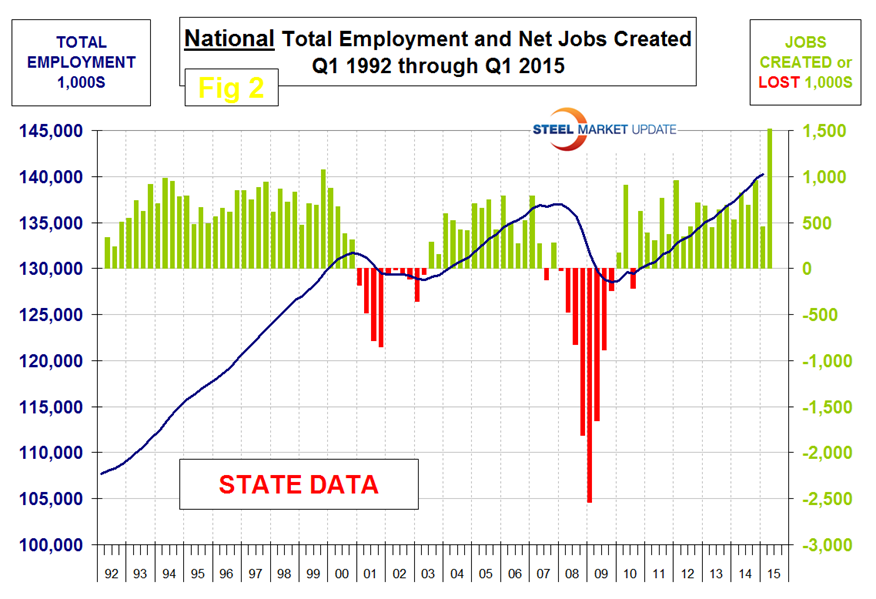
The states compile their employment numbers independently of the Feds then both are reported by the Bureau of Labor Statistics. The results are very close. In the last nine quarters since Q1 2013, the Feds reported total job creation of 5,992,000 and the states reported 5,895,000. Figure 1 and Figure 2 show the history of Federal and State totals since 1992. SMU has graphs in the same format for 10 geographic regions and can produce for individual states if a reader so requests.
There were some dramatic changes in regional job creation in Q1 2015 which we conclude were highly influenced by the decline in the price of crude and the continuing decline in the price of natural gas. The South central region, (Texas, Louisiana, Arkansas and Oklahoma) which had the highest rate of job creation of all regions in Q4 2014, crashed in Q1 2015 and had a net loss of jobs. Table 1 shows the history of quarterly job creation by region for the last four years.
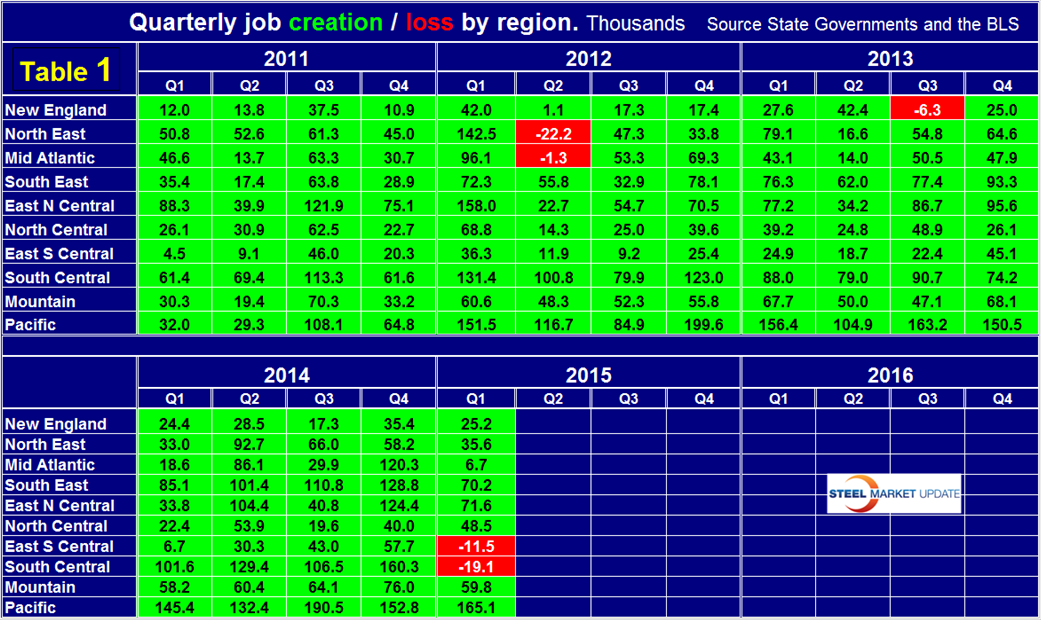
The East South Central region (Alabama, Mississippi, Kentucky and Tennessee,) also had negative job creation in Q1. The North Central region (Iowa, Kansas, Minnesota, Missouri, Nebraska and the Dakotas), and the Pacific region (California, Oregon and Washington) had an increase in Job creation in Q1. All other regions had a weaker performance but did have a net positive result. Drilling down to the state level reveals some notable changes; New York State created 34,000 of the 36,000 jobs in the North East Region, Florida and Georgia created 70,000 jobs of which 57,000 were in Florida, Michigan and Ohio between them created 46,000 jobs, Texas gained 4,000 jobs but Louisiana and Oklahoma lost 13,000 and 9,000 respectively which put the South Central into negative territory, North Dakota with a loss of 2,000 jobs was the only state in the North Central region to loose positions, all states in the Mountain and Pacific regions added jobs in Q1.
The regions have fared very differently since the pre-recession high of Q1 2008 and since the low point of Q4 2009. There are now 3,261,000 more people employed than there were immediately before the recession but of that number over a third were created in the South Central (TX, LA, AR and OK). The East North Central (IL, IN, MI, OH and WI) is now at break-even but the East South Central (AL, KEN, MIS, and TEN) have still not recovered all the jobs lost during the recession (Table 2).
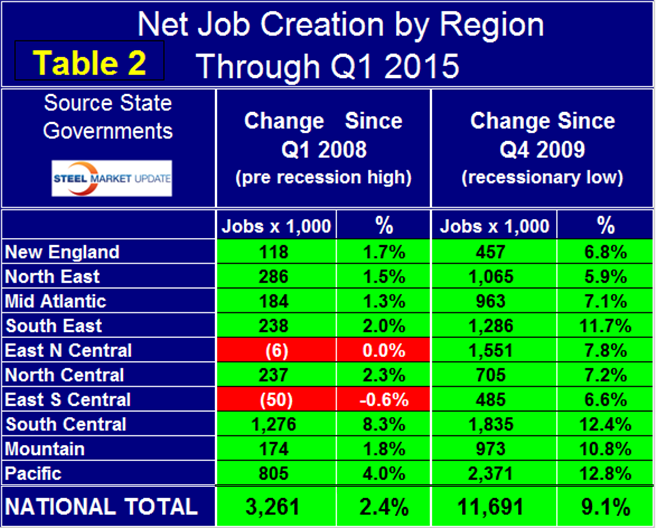
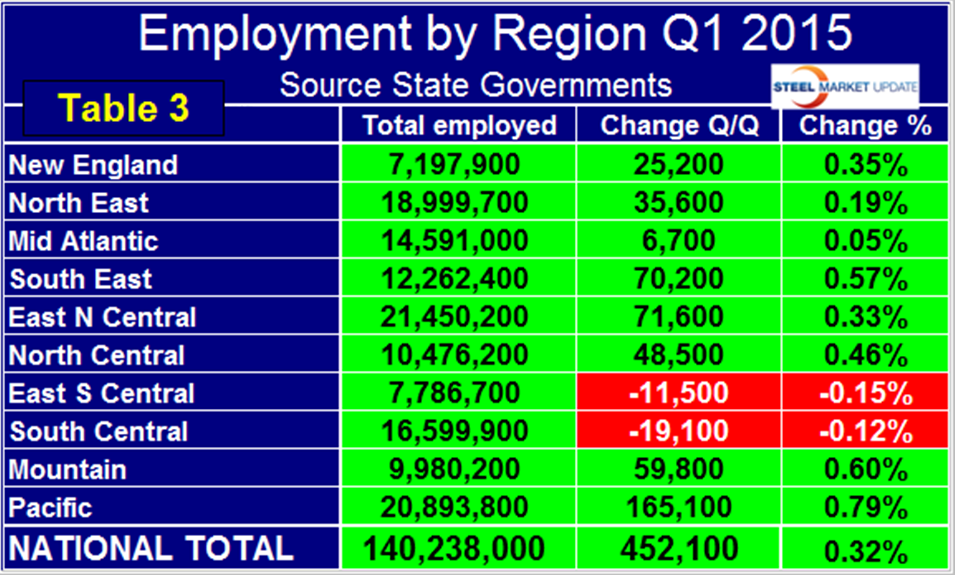
Employment is now 11,691,000 positions higher than it was at the low point of the recession. The Pacific has had the largest number of jobs created during the recovery with an increase of 2,371,000 new positions which amounts to 12.8 percent of total employment. The South Central is in second place with 1,835,000 jobs created which is 12.4 percent of total employment. The East North Central (IL, IN, MI, OH and WI) currently has the highest number of employed people with 21,450,200, followed by the Pacific with 20,893,800 (Table 3).