

Market Data

May 11, 2015
Net Job Creation through April 2015
Written by Peter Wright
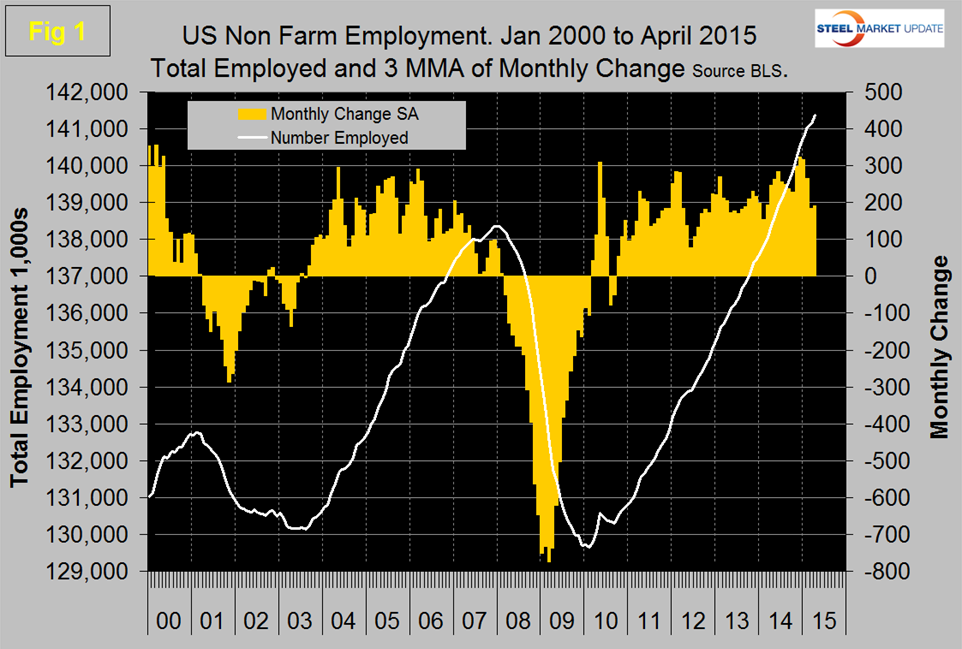
The Bureau of Labor Statistics (BLS) analysis of non-farm employment reported that 223,000 jobs were added in April but the March result was revised down by 41,000 to a mere 85,000. The three month moving average (3MMA) of gains through April was 191,000 and the combined result for March and April was the lowest since mid-2013 (Figure 1).
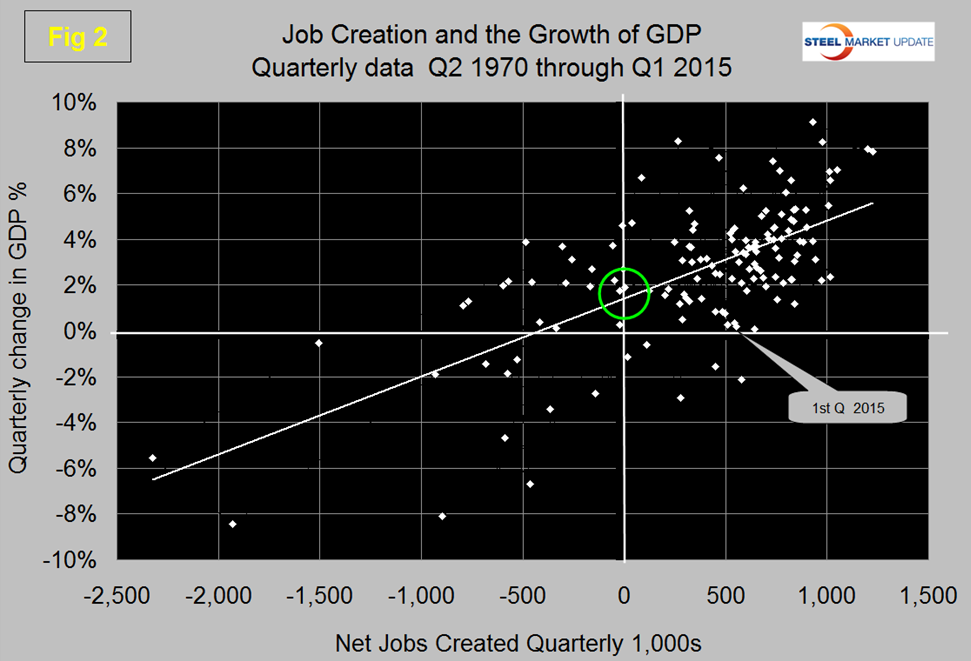
The growth of GDP in Q1 by the first estimate was 0.2 percent, if there is not a significant and immediate improvement or upward revision in this result then job creation will drop possibly into negative territory. Figure 2 shows the relationship between GDP growth and job creation and highlights the situation in Q1 2015.
Armada Executive Intelligence has a somewhat different view and made the following points this week, “There are 5.1 million jobs open (unfilled looking for qualified talent), the highest since 2000. Jobs are being created at a rate of about 200,000 a month. 10,000 Baby Boomers hit age 65 every day. And that will continue for the next 14 years. Wage pressure is coming. Cost pressures overall will come. Interest rate hikes will come. The dollar will fall and commodity prices will surge. Be ready to manage your organization through it – especially if we don’t get top line growth to help keep pace.”
Total non-farm payrolls are now 3,002,000 more than they were at the pre-recession high of January 2008. In the last twelve months the average monthly job creation has been 248,500 per month. All numbers in this analysis are seasonally adjusted by the BLS.
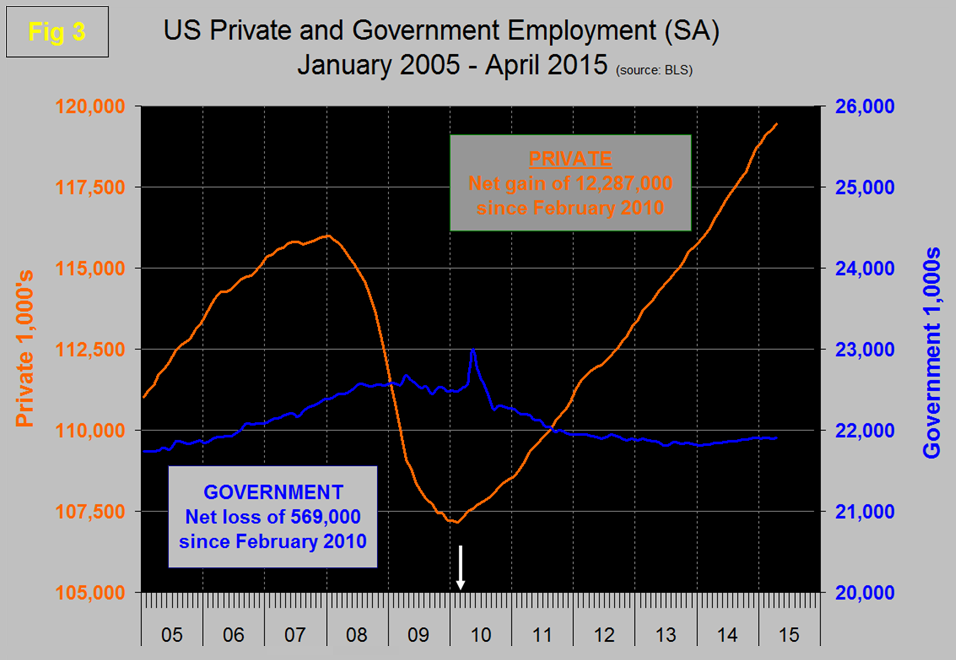
Table 1 slices total employment into service and goods producing industries and then into private and government employees. Total employment equals the sum of private and government employees. It also equals the sum of goods producing and service employees. Most of the goods producing employees work in manufacturing and construction and these sectors are further subdivided in Table 1.
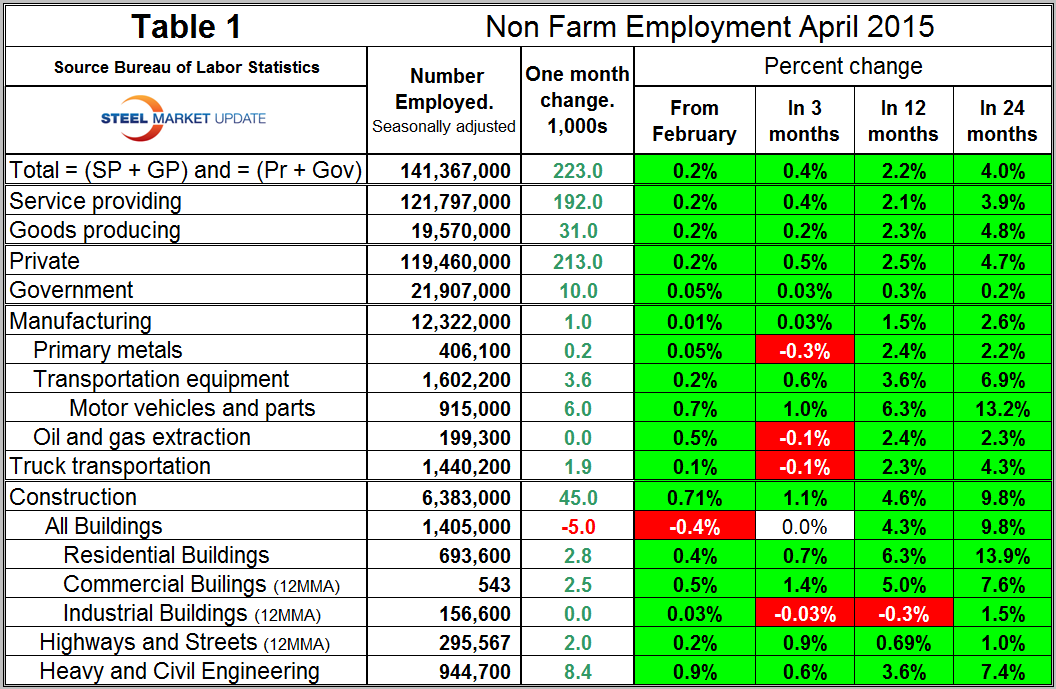
In April private employment grew by 213,000 and government by 10,000. Since February 2010, the employment low point, private employers have added 12,287,000 as government has shed 569,000 (Figure 3).
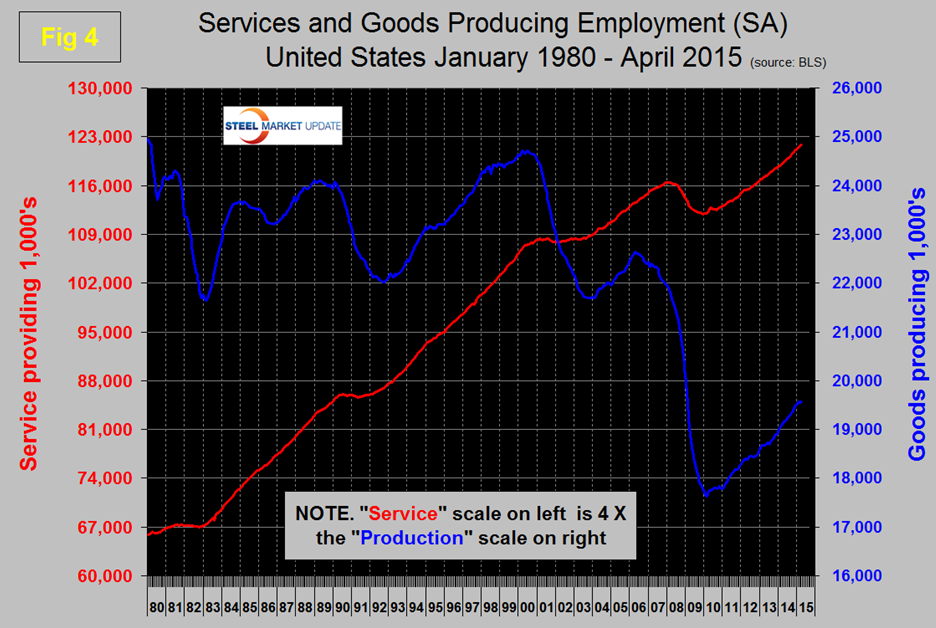
In April service industries expanded by 192,000 and goods producing by 31,000 people. Since February 2010, service industries have added 9,775,000 and goods producing 1,943,000 positions (Figure 4).
Manufacturing added only 1,000 jobs in April, well below the average of 15,000/month during the last 12 months. Transportation equipment which is mainly motor vehicles and parts was the strongest sector in manufacturing in April with 3,600 additions. Note; Table 1 only identifies the major sectors in manufacturing and construction so the totals don’t add up. Truck transportation added 1,900 jobs and is now back to the pre-recessionary peak of early 2007. Oil and gas extraction is not showing up in this latest report as a looser which considering the results from the South Central region (TX, OK, LA and AR) that we reported last week doesn’t make much sense. Moody’s Economy.com made the following observation before the April jobs data was released; “Our assumption is that job growth will be hurt this quarter by layoffs in energy-related industries and that is visible in the state-level claims data. In addition, the Challenger Report showed layoffs surging more than 68 percent to a three-year high in April, largely because of a spike in job cuts associated with falling oil prices. While the weakness in the energy industry will slow the labor market improvement slightly, both unemployment claims and other indicators suggest the general trend is moving in the right direction. Wage growth is expected to accelerate this year as unemployment continues to tick lower and firms find themselves needing to raise wages faster to find workers.”
The good news in the April data was that construction added 45,000 jobs, the best result since January 2014 when a reported 69,000 construction jobs were created. Note all these numbers are seasonally adjusted by the BLS. Heavy and civil engineering was the strongest sub sector of construction with a gain of 8,400 jobs in April. Building construction lost 5,000 jobs.
Since the bottom of the employment recession, construction has now overtaken manufacturing as a net job creator. Construction has added 883,000 jobs and manufacturing 869,000 in that time frame (Figure 5).
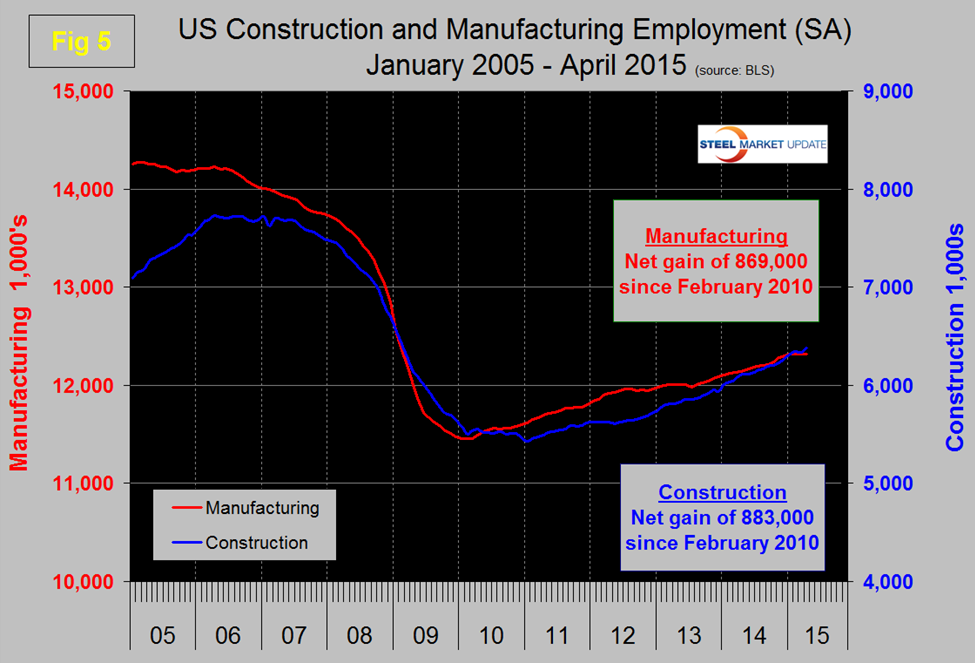
This bodes well for the sector that has been holding back steel demand.
The official unemployment rate decreased from 5.5 percent in January to 5.4 percent in April. This number known as the U3 rate doesn’t take into consideration those who have stopped looking. The more comprehensive U6 unemployment rate also decreased from10.9 percent in March to 10.8 percent in April (Figure 6).
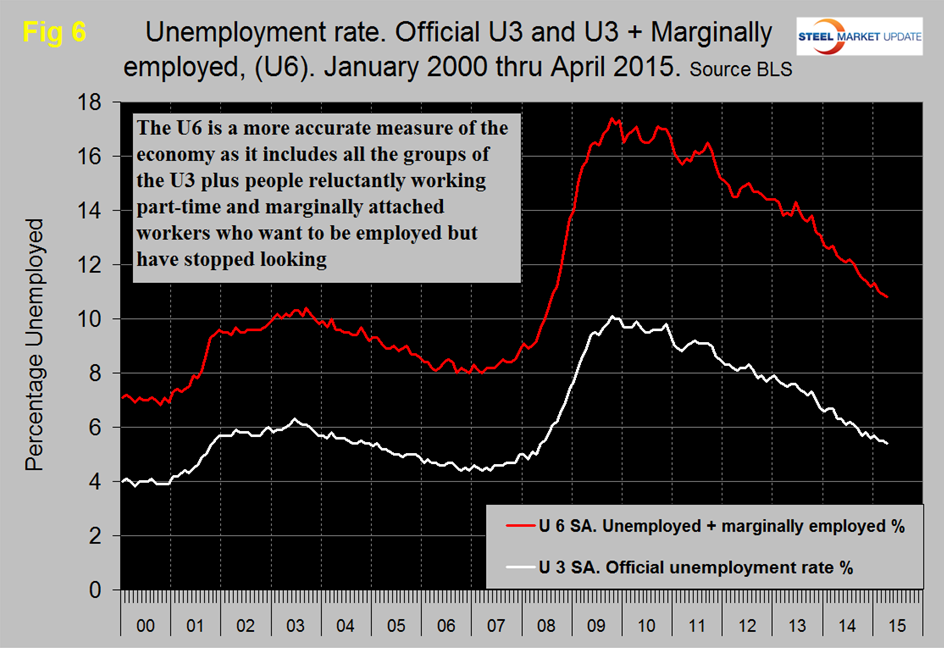
U6 includes workers working part time who desire full time work and people who want to work but are so discouraged that they have stopped looking. The differential between these rates was usually less than 4 percent before the recession but since January last year has averaged 5.78 percent. The good news is that the gap is slowly closing.
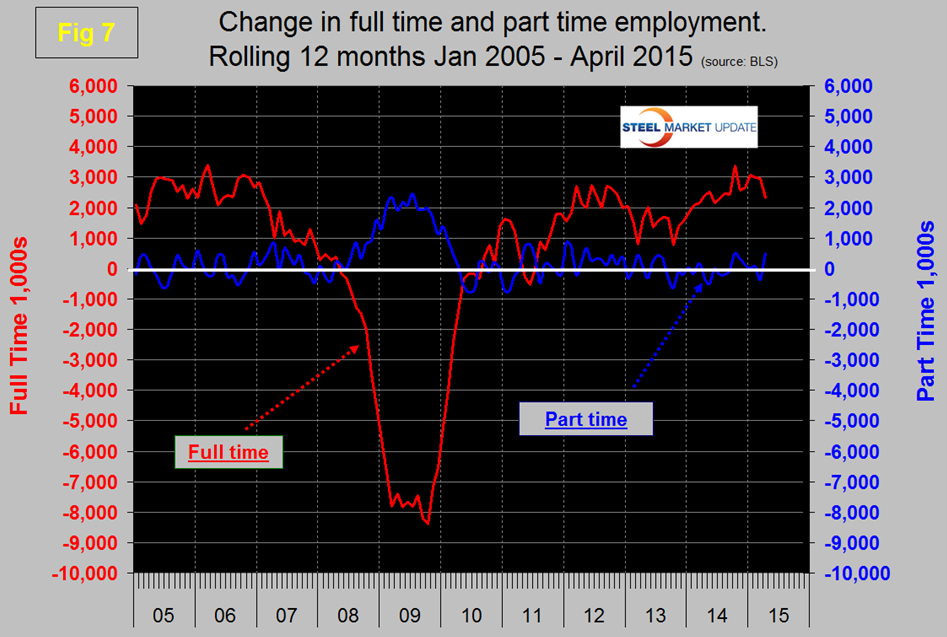
We read a lot in the press about full time and part time job growth (full time is 35+ hours per week), the reporting of which generally appears to us to be inaccurate. This data set is extremely erratic month to month so commentators can often pick up on a single number and run with it. At SMU we have concluded that the only way to get a realistic picture is to examine a 12 month rolling average which screens out most of the variability. By this reckoning the growth of part time employment hasn’t changed much in the last five years, the majority of the growth having been in full time (Figure 7). Since February 2010 the increase in full time employment has been 9,974,000 jobs as part time has added 121,000 jobs.
The global outplacement consultancy Challenger, Gray & Christmas, Inc. reported that job cuts in April were, the highest since May 2012. At SMU we consider the 3MMA which has been climbing steadily in the first four months of 2015 (Figure 8). We include this analysis as a reality check for the government statistics.
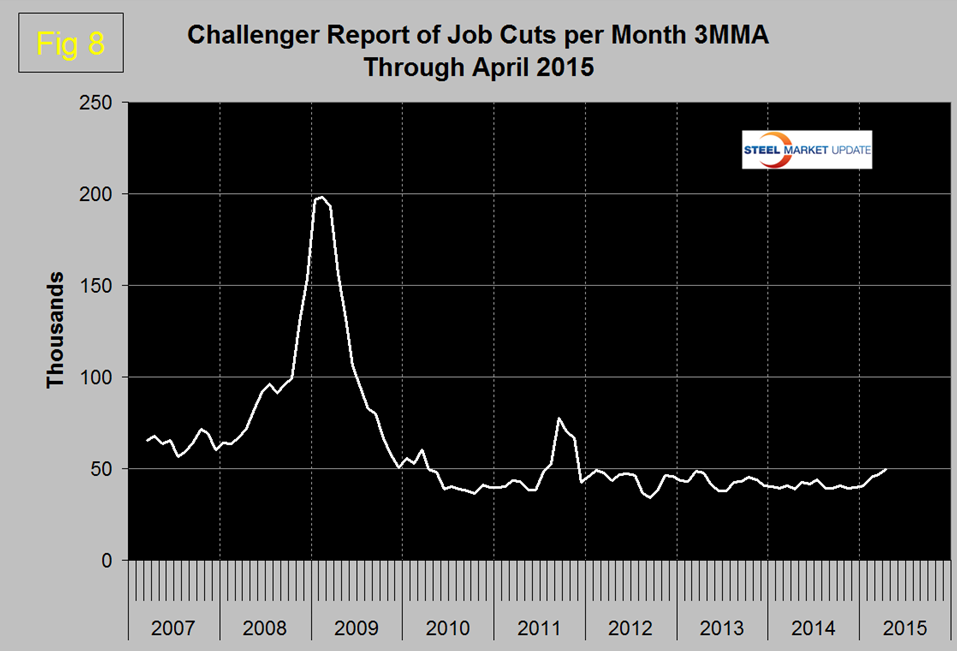
Job Cuts Surge to 3-Year High CHICAGO, May 7, 2015
Falling oil prices contributed to a 68 percent surge in job cuts last month, as US-based employers announced workforce reductions totaling 61,582 in April, up from 36,594 in March, according to the latest report on monthly layoffs released Thursday by global outplacement consultancy Challenger, Gray & Christmas, Inc.
The April total was 53 percent higher than the same month a year ago, when 40,298 planned job cuts were recorded. It represents the highest monthly total since May 2012 (61,887) and the highest April total since 2009 (132,590).
Year to date, employers have announced 201,796 planned job cuts, which marks a 25 percent increase from the 161,639 layoffs tracked in the first four months of 2014. This is the largest four-month total since 2010.
Driving the increased pace of job cutting in April and for the year is the dramatic decline in oil prices, which is forcing producers and suppliers to cut production. Of the 61,582 job cut announced last month, 20,675 or 34 percent were directly attributed to oil prices. For the year, oil prices were blamed for 68,285 job cuts, or about 34 percent of the 201,796 planned layoffs announced between January 1 and April 30.
The pace of retail sector job cuts is slightly higher than a year ago, when these employers announced 25,224 job cuts through the first four months. “Low oil prices should be helping retailers. However, the extra money in Americans’ wallets does not appear to be making it into the nation’s cash registers. Retail sales have been lackluster, at best. Furthermore, consumer products giant Procter & Gamble announced in April that it would reduce its headcount by as many as 6,000 workers over the next two years, following a poor earnings report,” noted Challenger. “We could be witnessing the after-effect of the severe and protracted recession. Much like the generation that lived through the Great Depression, those who scraped by during the recession are being extra careful with their money. Another factor is that not everyone’s boat is rising with the tide. Many Americans are still struggling to find work and those that do are not earning as much they once did,” he said.
SMU Comment: The April employment report was a bounce back from the dismal result in March but the 3MMA of the latest two months of data was the lowest since mid-2013. Commentaries seem to be mixed but leaning towards a tightening in the job market and an anticipated increase in labor costs. We are not convinced that the immediate future will play out that way and await revisions to Q1 GDP and results for the present quarter.


