

Market Data

June 12, 2015
Net Job Creation through May 2015
Written by Peter Wright
The Bureau of Labor Statistics (BLS) analysis of non-farm employment reported that 280,000 jobs were added in May and the March and April result was revised up by a total of 32,000. Economists had expected U.S. employers to add 220,000 jobs last month. The three month moving average, (3MMA) of gains through May was 207,000 which was up by 5,000 from April, (Figure 1).
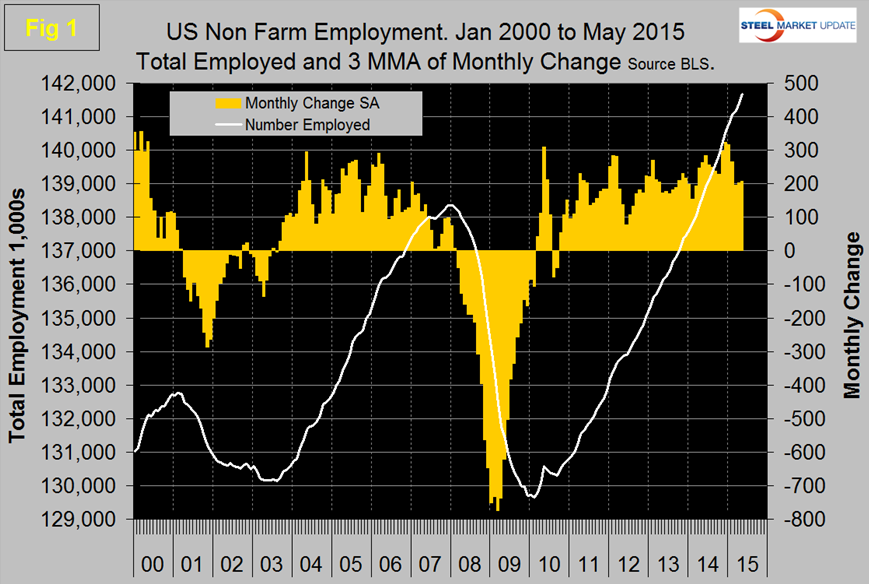
Total non-farm payrolls are now 3,314,000 more than they were at the pre-recession high of January 2008. In the last twelve months the average monthly job creation has been 255,000 per month. All numbers in this analysis are seasonally adjusted by the BLS.
Table 1 slices total employment into service and goods producing industries and then into private and government employees.
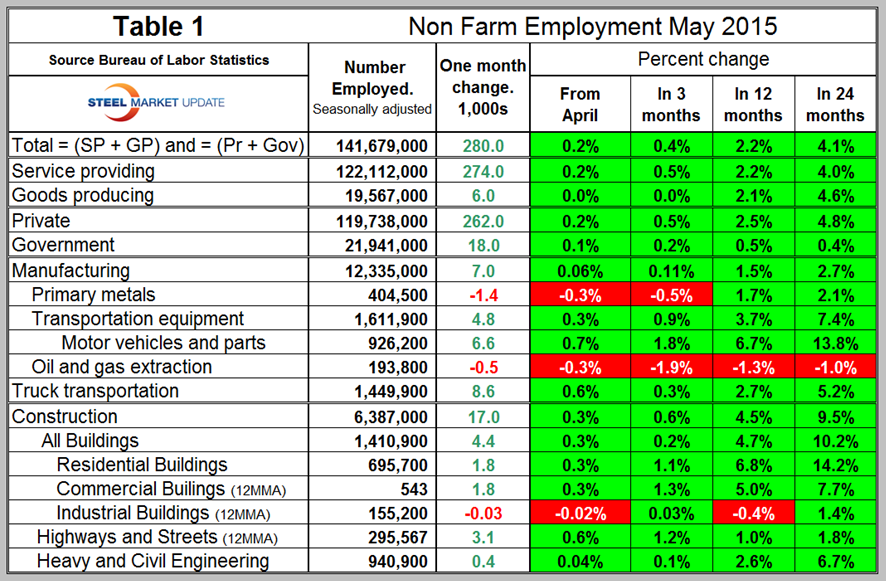
Total employment equals the sum of private and government employees. It also equals the sum of goods producing and service employees. Most of the goods producing employees work in manufacturing and construction and the major components of these two sectors are also shown in Table 1. In May private employment grew by 262,000 and government by 18,000. Since February 2010, the employment low point, private employers have added 12,565,000 as government has shed 535,000, (Figure 2).
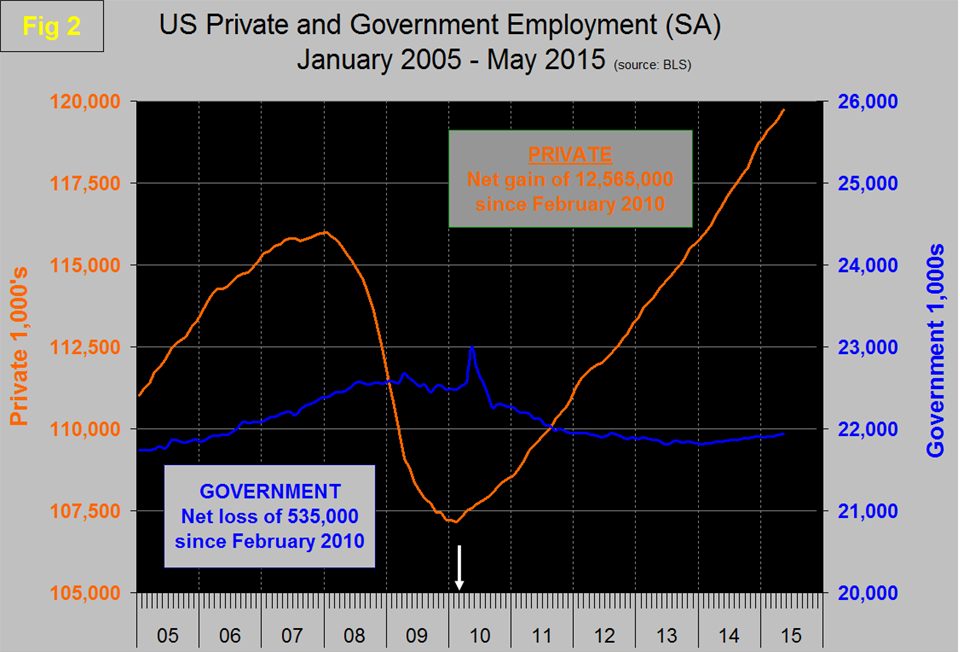
In May service industries expanded by 274,000 and goods producing by only 6,000 people. Since February 2010, service industries have added 10,090,000 and goods producing 1,940,000 positions, (Figure 3).
The BLS released productivity and labor cost data for Q1 2015 last week, (Figure 4).
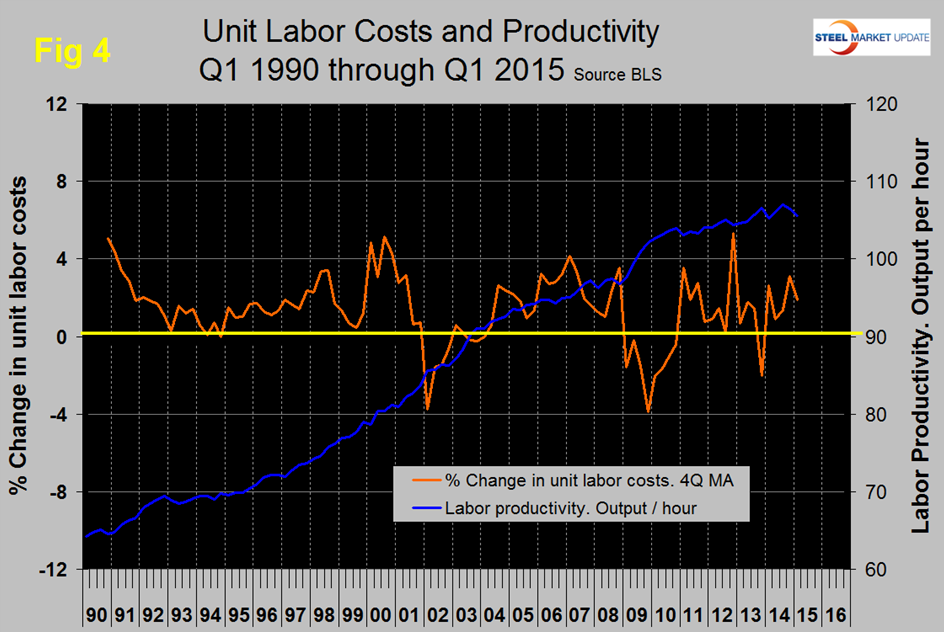
The growth in productivity has slowed since 2010 and unit labor costs have been trending up for two years. The latest Federal Reserve Beige Book released on Thursday had this to say about employment and wages; “Employment levels were up slightly across districts over the reporting period. Reports of hiring came from a variety of industries, and the Boston, Richmond, Atlanta, and St. Louis Districts noted employment gains in manufacturing. Some instances of layoffs were mentioned by the St. Louis, Minneapolis, and Dallas Districts. The Richmond District cited employment declines in West Virginia’s coal and gas industries and the Minneapolis District said online job openings in the energy-producing area of North Dakota were down significantly from a year ago. Reports of labor shortages spanned several districts including Boston, New York, Philadelphia, Cleveland, Richmond, Atlanta, Chicago, and Kansas City. An ongoing and widespread shortage of truck drivers was noted in the New York, Cleveland, and Kansas City Districts. Firms in the Cleveland, Atlanta, Chicago, and Minneapolis Districts reported difficulty retaining employees. The New York District said a sizable proportion of service-sector firms plan to expand employment in the months ahead.
Slight growth in wages was reported by most districts. A tight market for skilled construction labor in the Boston, Dallas, and San Francisco Districts pushed up wages for workers there, and staffing services firms in Boston, New York, and Dallas noted rising wages. The Richmond, Kansas City, and San Francisco Districts noted higher wages in the restaurant and/or hospitality industries. Some contacts in the IT sector in the San Francisco District reported rapid wage gains, and their counterparts in Boston noted rising wages as well. Employers in the Atlanta District were monitoring how recent minimum pay announcements from a number of employers would affect local labor markets. Contacts across various industries in the Chicago District reported a willingness to raise wages when necessary to attract and retain workers, and a notable share of reporting firms in the Minneapolis District also said they were increasing starting pay for most job categories to attract new hires.”
Returning to Table 1 we see that manufacturing added only 7,000 jobs in May and has added only 17,000 in the last four months. Motor vehicles and parts contributed 6,600 positions in May suggesting that manufacturing growth is very unbalanced at the moment. Note; Table 1 only identifies the major sectors in manufacturing and construction so the totals don’t add up. Truck transportation added 8,600 jobs, the strongest gain since December and is now almost back to the pre-recessionary peak of early 2007. Oil and gas extraction after a delayed response to reduced energy prices is now showing up in this latest report as a looser with employment level 1.0 percent less than two years ago. Primary metals was also a job looser in the last three months. Construction added 17,000 jobs in May, down from 36,000 in April. Note all these numbers are seasonally adjusted by the BLS. Since the bottom of the employment recession, construction has now overtaken manufacturing as a net job creator. Construction has added 887,000 jobs and manufacturing 882,000 since the recessionary employment low point in February 2010, (Figure 5).
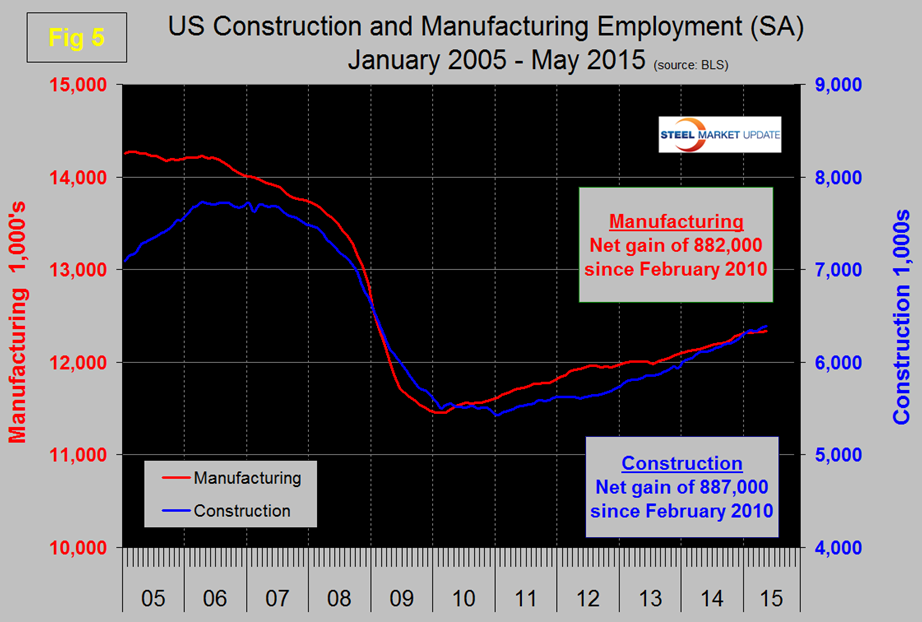
This bodes well for the sector that has been holding back steel demand.
The official unemployment rate decreased from 5.7 percent in January to 5.4 percent in April then slipped back to 5.5 percent in May. This number known as the U3 rate doesn’t take into consideration those who have stopped looking. The more comprehensive U6 unemployment rate decreased from 11.3 percent in March to 10.8 percent in April and was unchanged in May, (Figure 6).
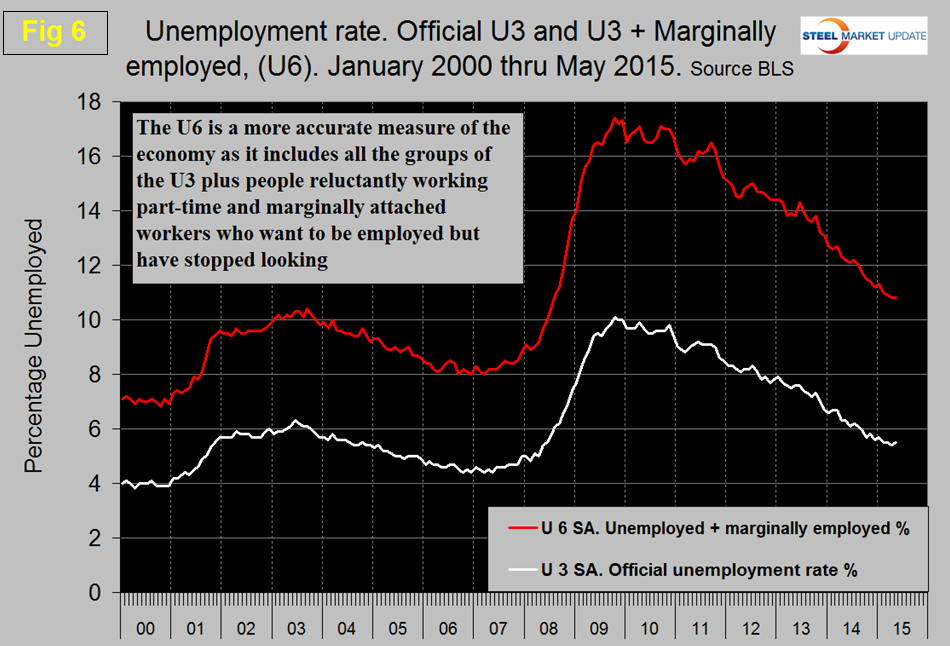
U6 includes workers working part time who desire full time work and people who want to work but are so discouraged that they have stopped looking. The differential between these rates was usually less than 4 percent before the recession but since January last year has averaged 5.78 percent. The good news is that the gap is slowly closing.
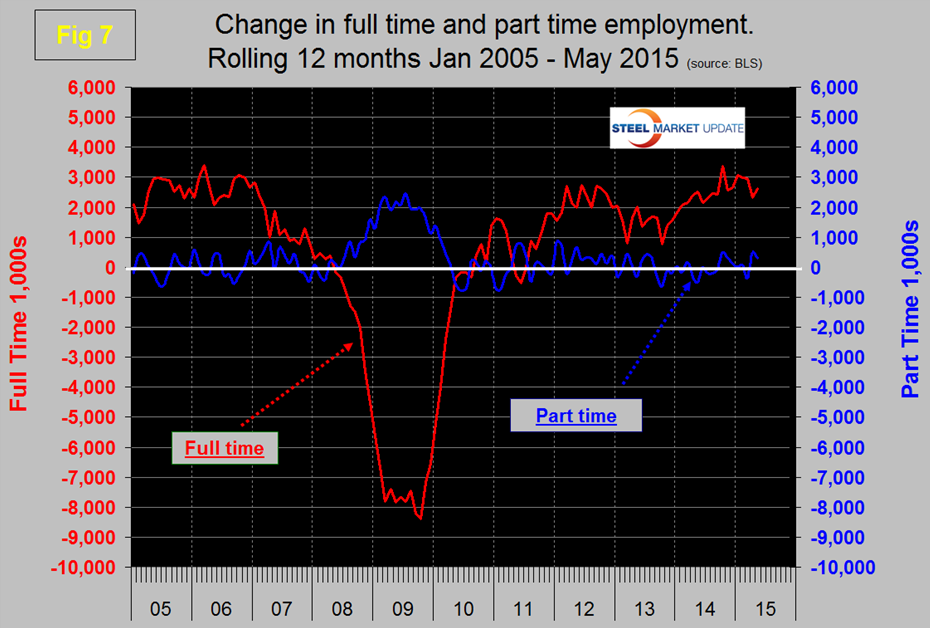
So far in 2015 there has been exactly zero increase in part time employment. Figure 7 shows the rolling 12 month total change in both part time and full time employment.
SMU Comment: The increase in manufacturing employment YTD at 34,000 is well below the 63,000 manufacturing jobs creates in the first five months of 2014. This supports other manufacturing data that we routinely report in the SMU. Construction employment also increased less in the first five months of 2015 compared to 2014 with gains of 112,000 and 177,000 respectively. We are living in what is increasingly a service economy which has added 1,009,000 jobs this year compared to only 78,000 for goods producing which is mainly manufacturing and construction.


