

Analysis

June 17, 2015
Housing Starts, Permits and Builder Confidence
Written by Peter Wright
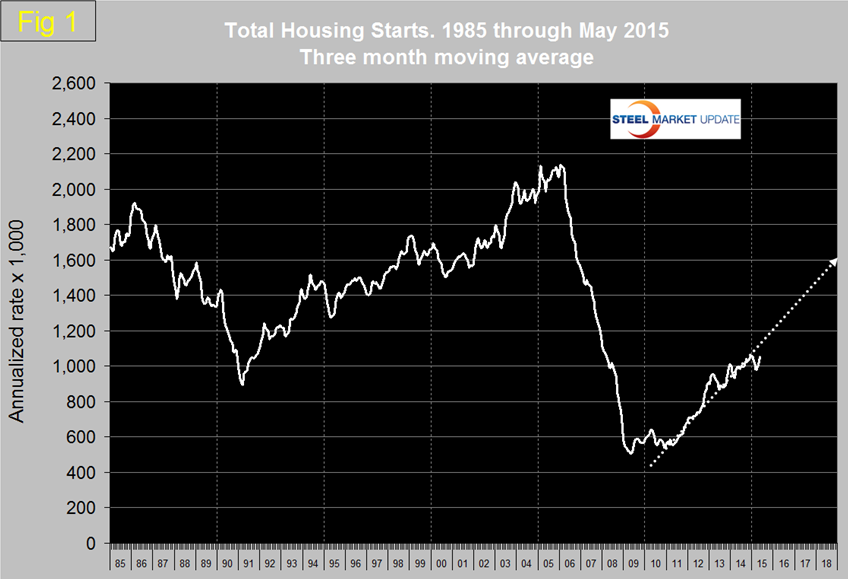
The surprisingly strong housing starts result for April was not repeated in May but the three month moving average did increase. Total starts were 1,036,000 down from 1,165,000 in April. This is an example of why we always focus on three month moving averages (3MMA) at SMU and don’t get too excited or depressed by a single months result. On that basis, single family at 674,000 was up by 4.1 percent month over month and up by 5.0 percent year over year. Multi-family was up by 5.5 percent both m/m and y/y.
The Census department results are seasonally adjusted and the monthly numbers are annualized. Figure 1 shows the 3MMA of total housing starts projected through 2018. This projection is probably optimistic as the trajectory for the last two years does not get us to 1.6 million, more like 1.3 million.
Multi-family starts are now beyond the pre-recession high of February 2006 but the growth of starts in this sector has slowed dramatically from a 3MMA year over year of 35.5 percent in August last year to 5.5 percent in May, (Figure 2).
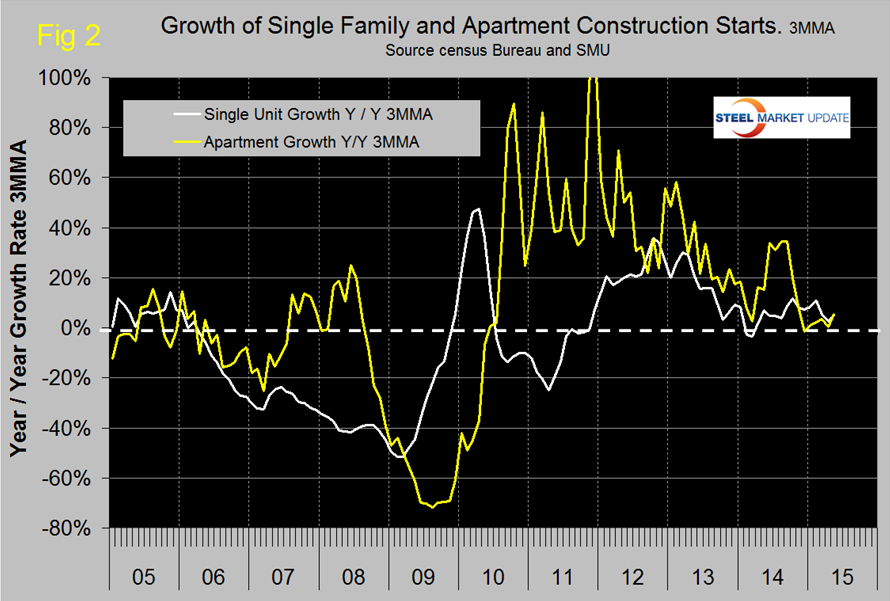
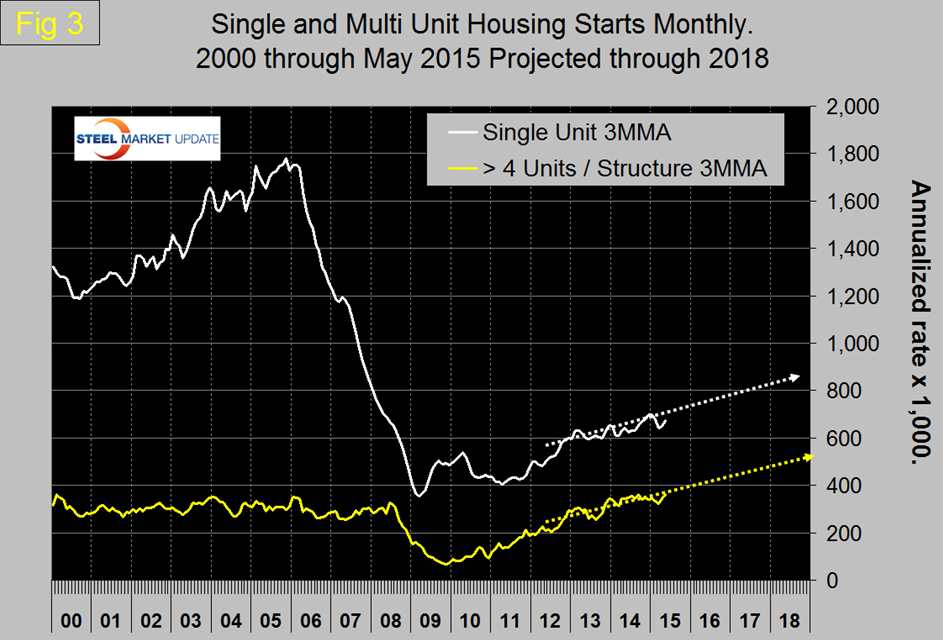
If we ignore the growth spurt of mid-2014, this sector has been slowing since early 2012 and may be approaching saturation. Single family is still 62.7 percent below the pre-recession level. Figure 3 shows the trajectory of single family and apartments.
Permit data is useful is useful as a forward look at starts. If permits exceed starts then we anticipate an acceleration in construction starts and vice versa. The surprising element in the May housing report was that total permits were up by 11.8 percent from the April result with a much wider divergence than normal between permits and starts, (Figure 4). This bodes well for starts later in the year.
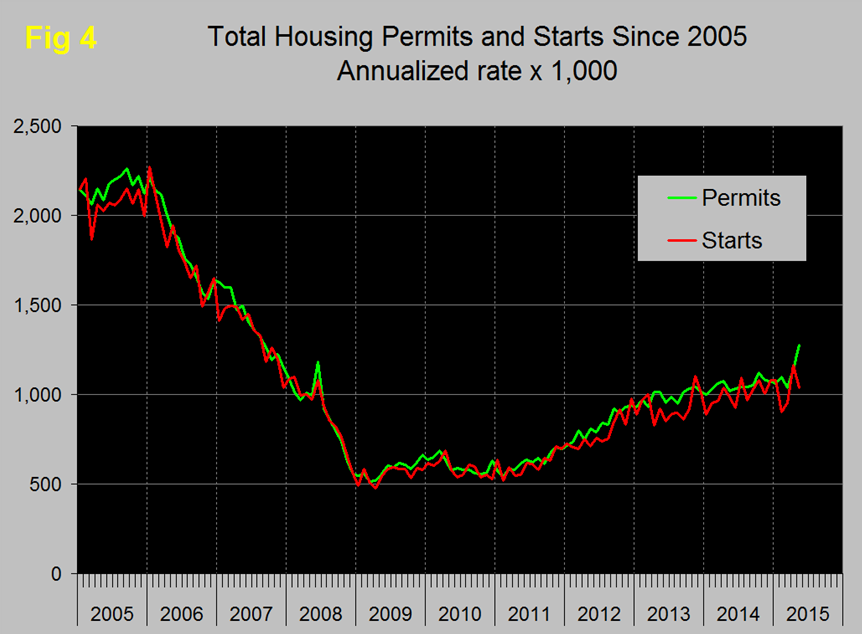
Table 1 shows total permits and starts nationally and regionally.
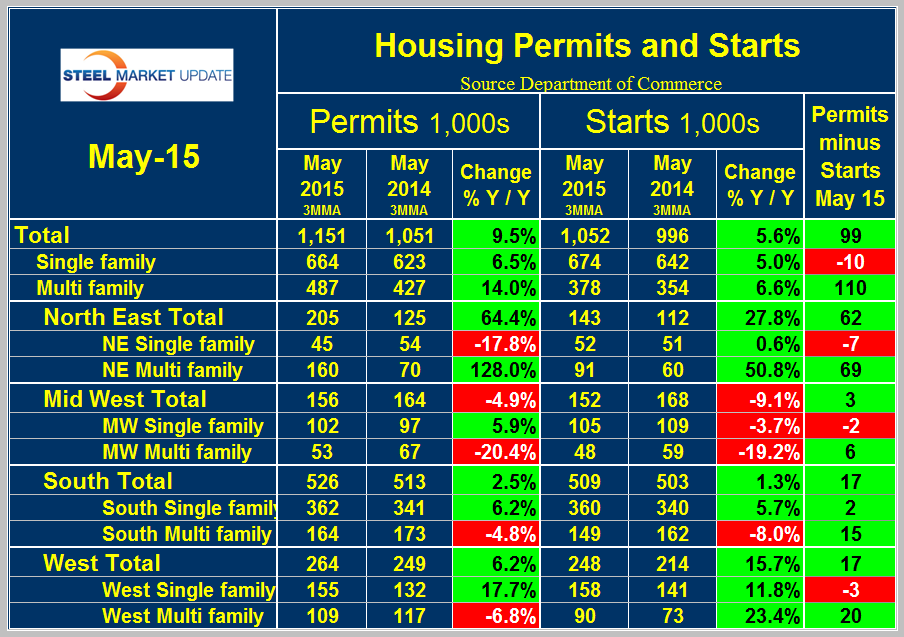
At the national level the differential between permits and starts for single and multi-family units is suggesting that the shift in consumer’s preference towards apartments is far from over. In May on a 3MMA basis, permits of multi-family exceeded starts by 110,000 in contrast to the negative 10,000 for single family. In total permits were 99,000 more than starts which was an almost exact repeat of the April result. The differential between permits and starts for multi and single family units was the same across all regions with permits for multi-family exceeding starts and except in the South, permits for single family were less than starts. The implication is that apartment construction is poised to surge strongly and that single family construction will slow slightly. The ratio of the two sectors is shown in Figure 5 and demonstrates that single family homes continue to be less desirable than at any time in the last 30 years.
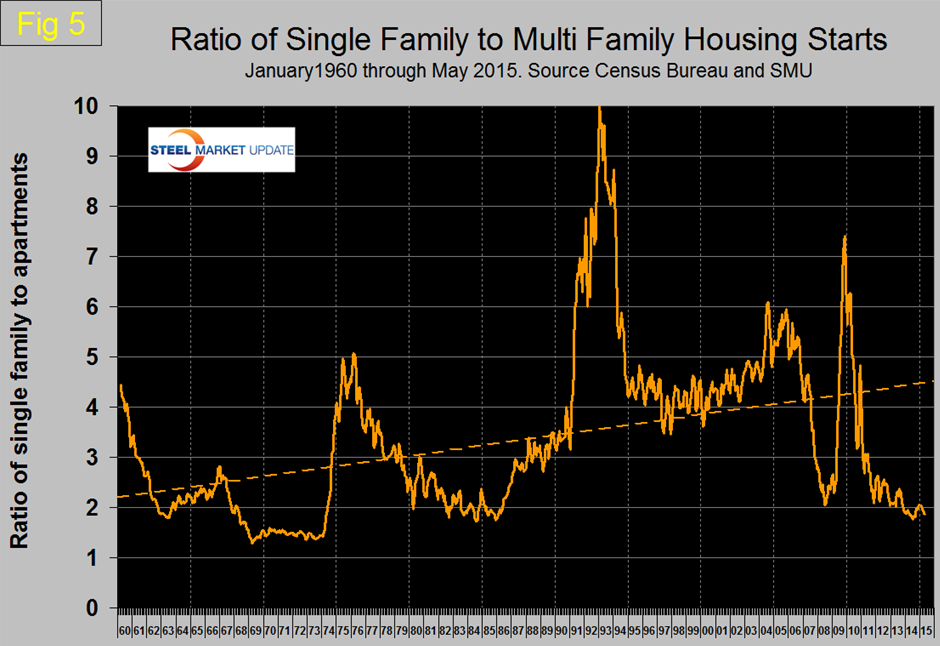
Based on permit data the ratio will not change any time soon. We try not to repeat ourselves too much in these reports but we regard this housing issue as so important that it can’t be overstated. It looks as though we are experiencing a generational shift in home preference driven by student loan debt and the realization that increasingly a job is not forever and the opportunity to be mobile is desirable. In addition the purchase of a house as an investment is not as attractive as it was before the recession. These issues promote the idea of rent in preference to purchase.
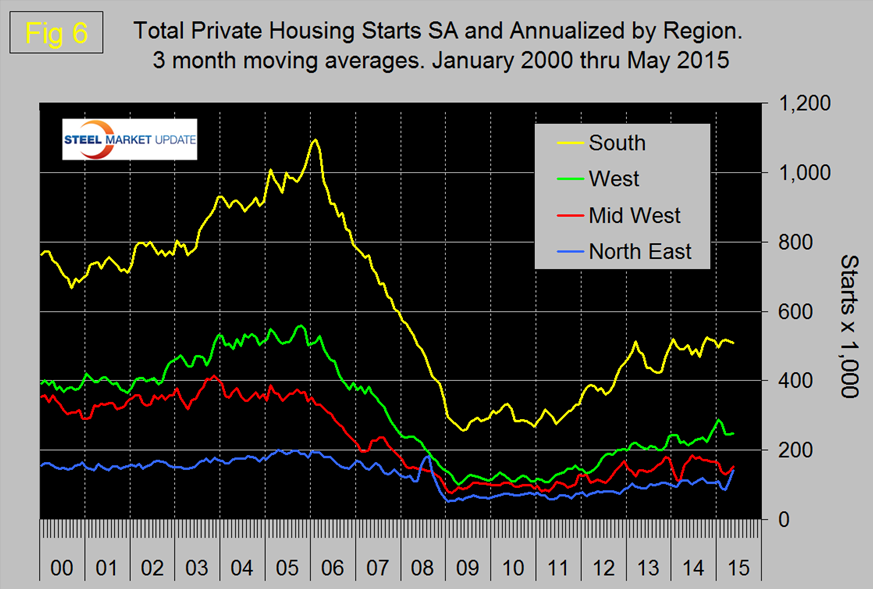
Figure 6 shows the regional situation for the 3MMA of total residential starts since February 2000. In 2015 the North East is performing the best.
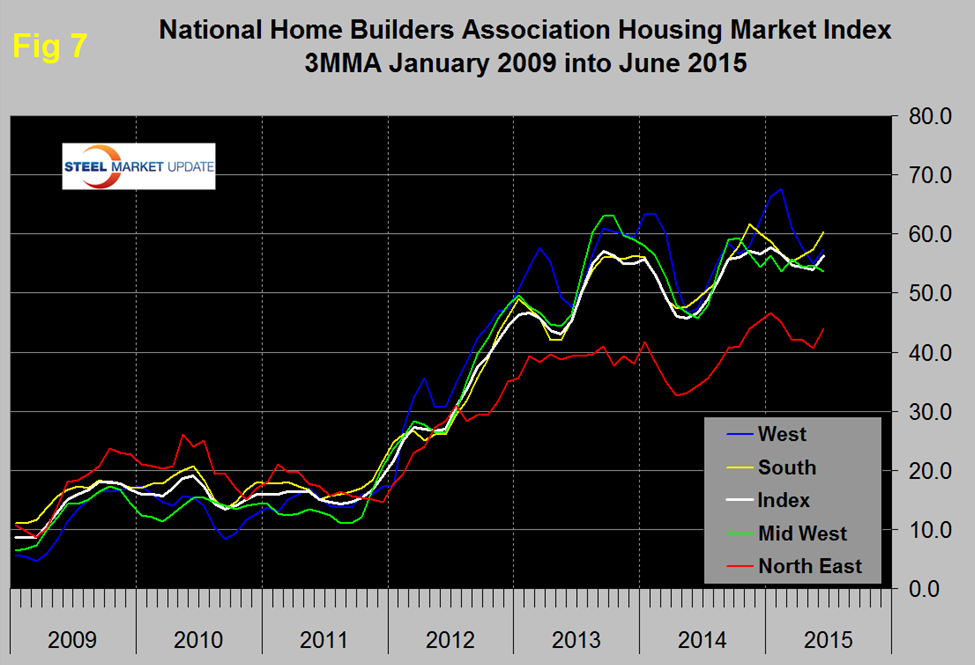
The National Association of Home Builders (NAHB) confidence report was released on Monday. Any value above 50 indicates an overall positive business confidence. The index jumped five points in the June survey to 59 and the 3MMA rose from 54.0 to 56.3. The Mid West was the only region to see a decline in the 3MMA in June, (Figure 7).
The official release from the NAHB was as follows:
Builder Confidence Hits Yearly High in June
Builder confidence in the market for newly built, single-family homes in June rose five points to a level of 59 on the National Association of Home Builders/Wells Fargo Housing Market Index (HMI) released on Monday. This is the highest reading since September 2014.
“Builders are reporting more serious and committed buyers at their job sites and this is reflected in recent government data showing that new-home sales and single-family construction are gaining momentum,” said NAHB Chairman Tom Woods, a home builder from Blue Springs, Mo.
“The HMI indices measuring current and future sales expectations are at their highest levels since the last quarter of 2005, indicating a growing optimism among builders that housing will continue to strengthen in the months ahead,” said NAHB Chief Economist David Crowe. “At the same time, builders remain sensitive to consumers’ ability to buy a new home.”
Derived from a monthly survey that NAHB has been conducting for 30 years, the NAHB/Wells Fargo Housing Market Index gauges builder perceptions of current single-family home sales and sales expectations for the next six months as “good,” “fair” or “poor.” The survey also asks builders to rate traffic of prospective buyers as “high to very high,” “average” or “low to very low.” Scores for each component are then used to calculate a seasonally adjusted index where any number over 50 indicates that more builders view conditions as good than poor.
All three HMI components posted healthy gains in June. The component gauging current sales conditions jumped seven points to 65, the index charting sales expectations in the next six months increased six points to 69, and the component measuring buyer traffic rose five points to 44.
Looking at the three-month moving averages for regional HMI scores, the South and Northeast each rose three points to 60 and 44, respectively. The West posted a two-point gain to 57 while the Midwest dropped by one point to 54.


