

Market Data

June 18, 2015
Oil and Gas Prices and Rotary Rig Counts in June 2015
Written by Peter Wright
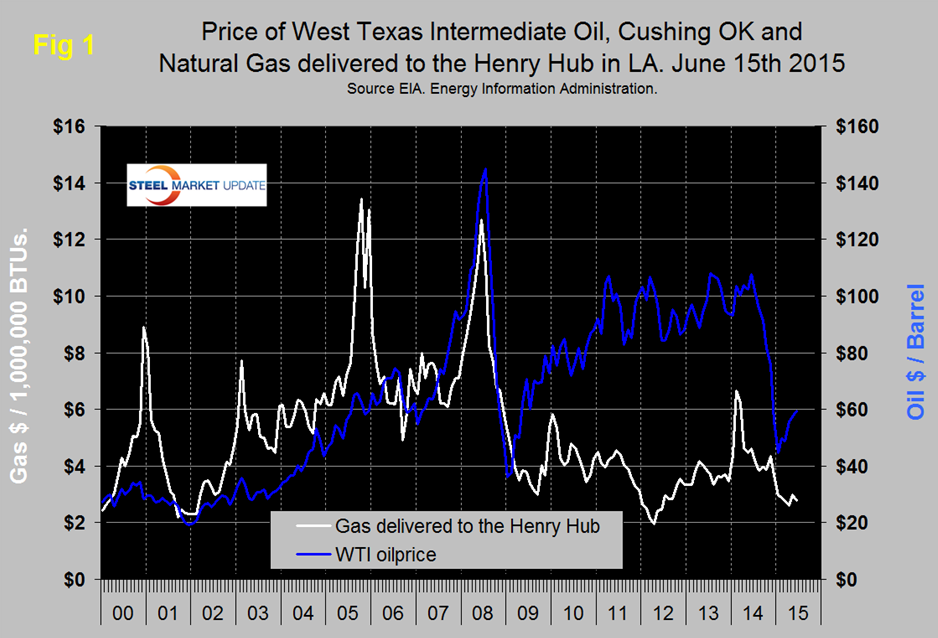
Figure 1 shows historical gas and oil prices since January 2000. The daily spot price of West Texas Intermediate fell below $100 per barrel in August and by January 23rd was down to $44.80.
By June 15th, the latest daily figure available from the Energy Information Administration (EIA) the price of WTI had recovered to $59.53. Brent closed at $60.99 on the same day. Natural gas delivered to the Henry Hub in Louisiana fell to $3.85/MM BTUs in August, there was an uptick in November followed by a five month decline, a 38 cent uptick in May followed by a decline of 21 cents so far in June to reach $2.78 on the 12th.
Saudi Arabia says its strategy of squeezing high-cost rivals such as U.S. shale producers is succeeding, as it seeks to reassert itself as the dominant force in the global oil market. “There is no doubt about it, the price fall of the last several months has deterred investors away from expensive oil including U.S. shale, deep offshore and heavy oils,” a Saudi official told the Financial Times. The kingdom’s production rose to a record high of 10.3M bpd in April. OPEC left its current production ceiling of 30M bpd unchanged at its meeting in Vienna on June 6th, renewing its support for the shock treatment it doled out late last year, keeping the market oversupplied. With oil prices having rebounded by more than a third after hitting a six-year low in January, OPEC officials see little reason to change a strategy that seems to have resurrected oil consumption and put a damper on the U.S. shale boom. This is a signal for members to pump as much as they like and sets the stage for battles for global market share this summer.
Gas and oil prices are reflected in the drill rig count. Figure 2 shows the Baker Hughes US Rotary Rig Count which is a weekly census of the number of drilling rigs actively exploring for or developing oil or natural gas in the United States. Rigs are considered active from the time they break ground until the time they reach their target depth and may be establishing a new well or sidetracking an existing one. The Baker Hughes Rotary Rig count includes only those rigs that are significant consumers of oilfield services and supplies.
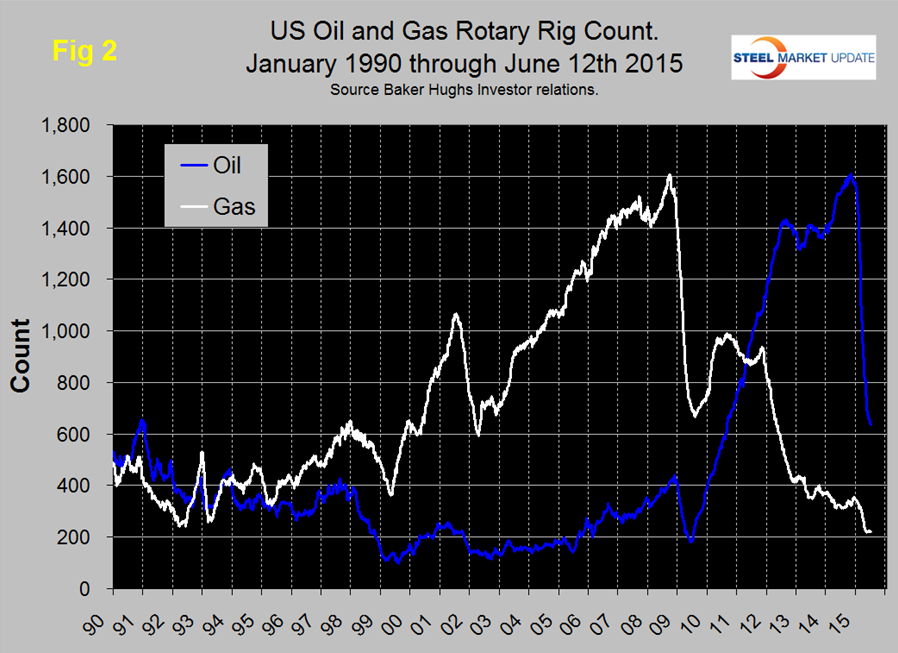
Figure 2 shows that the oil rig count which had been trending flat for almost two years, accelerate in 2014 until October 10th when it reached 1,609 and has since responded to the collapsing oil price by declining to 635. Year over year the oil rig count is down by 58.8 percent. Through June 12th there was a barely perceptible slowdown in the rate of decline of oil rigs. The gas rig count now stands at 221, down by 28.7 percent year over year and is lower than any other time since our earliest data of January 1990. Canadian rig counts on June 12th were as follows, oil 68 operating rigs, down by 54.4 percent y/y and gas 59 rigs down by 37.9 percent y/y.
The total number of operating rigs in the US and Canada is now 983 an increase of 23 in the last month but a decrease of 53.1 percent y/y. On a regional basis in the US the big three states for operating rigs are Texas, Oklahoma and North Dakota. Texas at 363 on June 12th was down by 9 in the last month and by 59.4 percent since the peak on September 26th. On the same basis Oklahoma at 107 was up by 4 and down by 49.8 percent and North Dakota at 76, down 3 and down by 59.8 percent.
There was some good news about fracking in the last few days; There is no evidence that fracking has had a “widespread, systemic impact on drinking water,” according to the EPA’s five-year analysis of U.S. water pollution risks. While there have been some cases involving spills and leaking wells, the spread of fracking did not cause extensive damage to groundwater resources, the agency added. The report follows the recent fracking bans in New York and Maryland.
Mark J Perry, professor of economics at the University of Michigan made a summer trip to the Bakken oil fields this year. Here is his bottom line; “Overall, I think what impressed me the most about visiting the Bakken oil fields is the amazing technical sophistication involved in drilling for shale resources in reservoirs miles below the Earth’s surface, and then drilling out laterally (horizontally) for several more miles to extract oil from saturated shale rock formations that were previously inaccessible with the traditional drilling and extraction technologies. We can thank American petropreneurs like Continental’s Harold Hamm who persevered for decades until they finally “cracked the shale code” with revolutionary, breakthrough drilling and extraction technologies that have transformed America in an energy superpower. More than most people think, the oil and gas business is a very, very high-tech industry that uses cutting-edge, advanced engineering, geological and drilling technologies that continually advance and improve. The technological innovation that unlocked the nation’s oceans of shale resources hasn’t stopped but instead has actually intensified. New ideas, technologies and ways of cracking the shale code emerge daily, as America’s “petropreneurs” get better and better at what they do all the time.
Steel Market Update’s view is that the changes presently taking place in the global energy markets could change overnight if Saudi Arabia is drawn into an active conflict with Iran over the situation in Yemen, or if OPEC reverses its position on production levels. In the meantime steel demand will be negatively impacted as reduced drilling activity ripples through the supply chain as is already the case for OCTGs. Goldman Sachs concluded an analysis earlier this month suggesting that over 10 percent of steel demand in the US is energy related. The decline in global oil prices has reduced the incentive to invest in non-traditional wells, (horizontal) but US oil production has not yet declined.


