

Analysis

July 1, 2015
Construction Expenditures (CPIP) Through May
Written by Peter Wright
Each month the Commerce Department issues its Construction Put In Place (CPIP) data, usually on the first working day covering activity two months earlier. May data was released on Wednesday July 1st and historical data was revised back to January 2013.
![]() Construction Put in Place is based on spending work as it occurs, estimated for a given month from a sample of projects. In effect the value of a project is spread out from the project’s start to its completion. Construction starts data published by the Commerce Department for residential construction and by McGraw Hill/Dodge and Reed Construction for non-residential is completely different as in these cases the whole project is entered to the data base when ground is broken. This results in the starts data being extremely spiky which is not the case with CPIP.
Construction Put in Place is based on spending work as it occurs, estimated for a given month from a sample of projects. In effect the value of a project is spread out from the project’s start to its completion. Construction starts data published by the Commerce Department for residential construction and by McGraw Hill/Dodge and Reed Construction for non-residential is completely different as in these cases the whole project is entered to the data base when ground is broken. This results in the starts data being extremely spiky which is not the case with CPIP.
The official CPIP press report gives no appreciation of trends on a historical basis and merely compares the current month with the previous one on a seasonally adjusted basis. The detail is hidden in the published data tables which we at SMU dissect to provide a long term perspective. Our intent is to provide a rout map for those subscribers who are dependent on this industry to “Follow the money.” This is a very broad and complex subject therefore to make this monthly write up more comprehensible we are keeping the information format as consistent as possible. Data is reported by the Commerce Department on both a seasonally adjusted and non-adjusted basis. Their official commentary is based on adjusted numbers. In the SMU analysis we consider only the non-seasonally adjusted data and get rid of seasonal effects by comparing three month expenditures year over year.
In the four tables below we present the non-seasonally adjusted expenditures for the most recent month of data. Growth rates presented are all year over year and are the rate for the single months result, the rolling 3 months and the rolling 12 months. The arrows indicate momentum. If the rolling 3 month growth rate is stronger than the rolling 12 months we define this as positive momentum and vice versa. In the text below when we refer to growth rate we are describing the rolling 3 months year over year rate. In Figures 1 through 4 below the blue lines represent the rolling 12 month expenditures and the brown bars represent the rolling 3 month year over year growth rates.
Total Construction:
May expenditures were $78.4 billion which breaks down to $54.6 B of private work, $22.0 B of state and locally, (S&L) funded work and $1.9 B of federally funded, (Table 1).
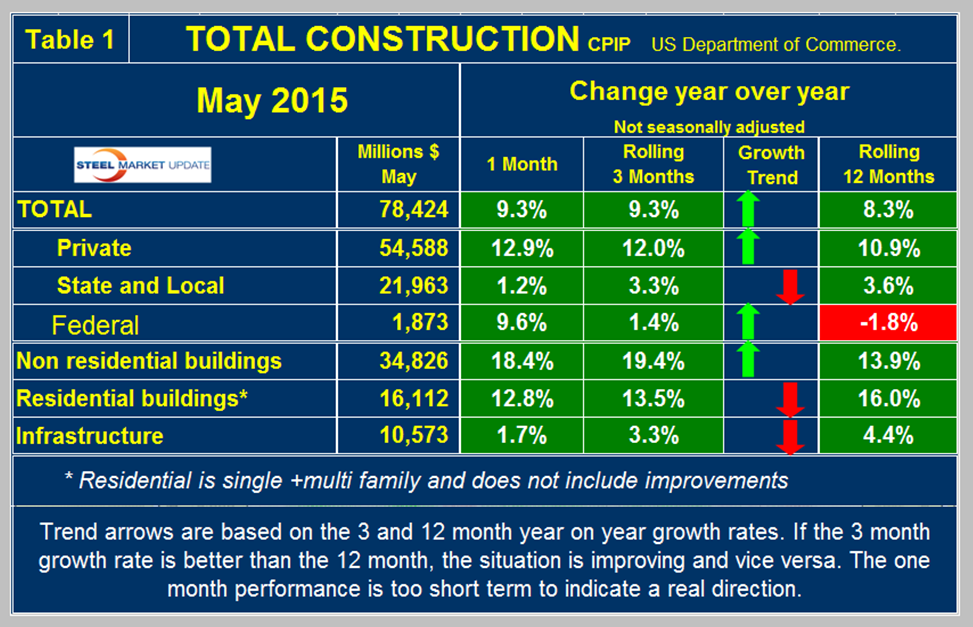
Revisions back to January 2013 were positive and moved the projected date at which total construction will reach the pre-recession level back to Q2 2017. On a rolling three month basis y/y total construction was up by 9.3 percent led by private work up by 12.0 percent. Total construction growth is accelerating since the short term growth (3 months 9.2 percent) is higher than the long term, (8.3 percent). We report this as positive momentum. Note this is not a seasonal effect because our y/y analysis removes seasonality. Privately funded work had positive momentum in this latest report but state and local work had negative momentum. Federally funded work which is minor compared to the other two classifications is minor but had positive momentum. We consider three sectors within total construction. These are non-residential, residential and infrastructure. The growth rate of non-residential buildings is a very high at 19.4 percent and accelerating. Residential is growing at 13.5 percent and has been slowing for 25 straight months. Infrastructure grew 3.3 percent in three months through May year over year with negative momentum. The growth rate of total construction slowed in the first three months of this year but improved in April and May as shown by the brown bars in Figure 1.
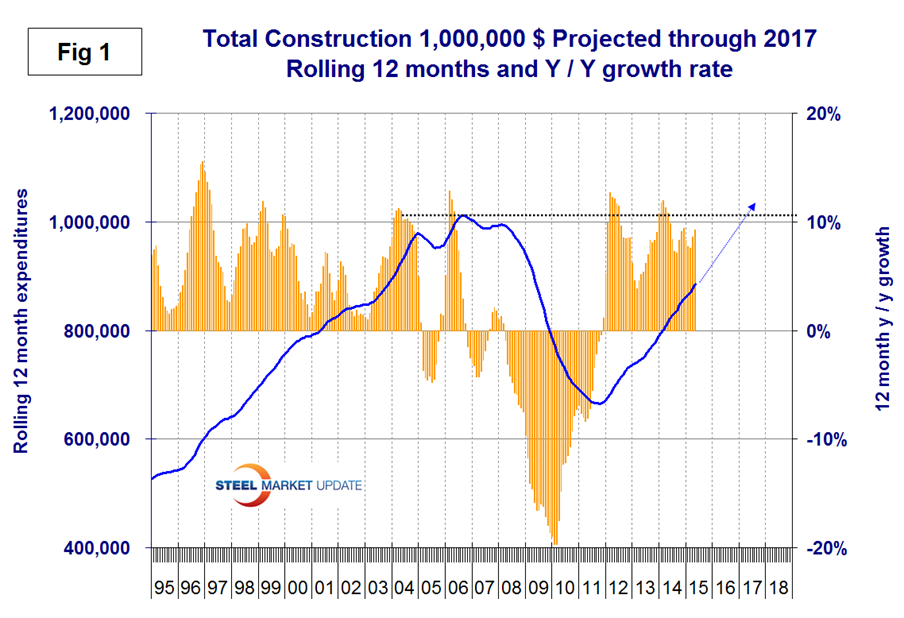
The pre-recession peak of total construction on a rolling 12 month basis was $1,145 B in 12 months through February 2007. The low point was $665.1 B in 12 months through October 2011. The 12 month total through the latest data of May 2015 was $885.5 B.
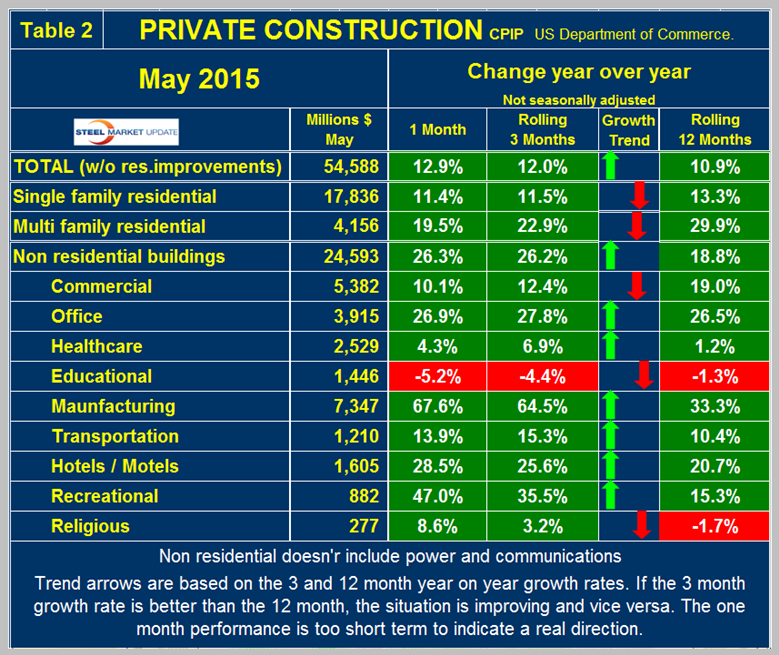
Private Construction: Table 2 shows the breakdown of total private expenditures into residential and non-residential and sub-sectors of both.
The growth rate of private construction was 12.0 percent in the last three months as shown by the brown bars in Figure 2.
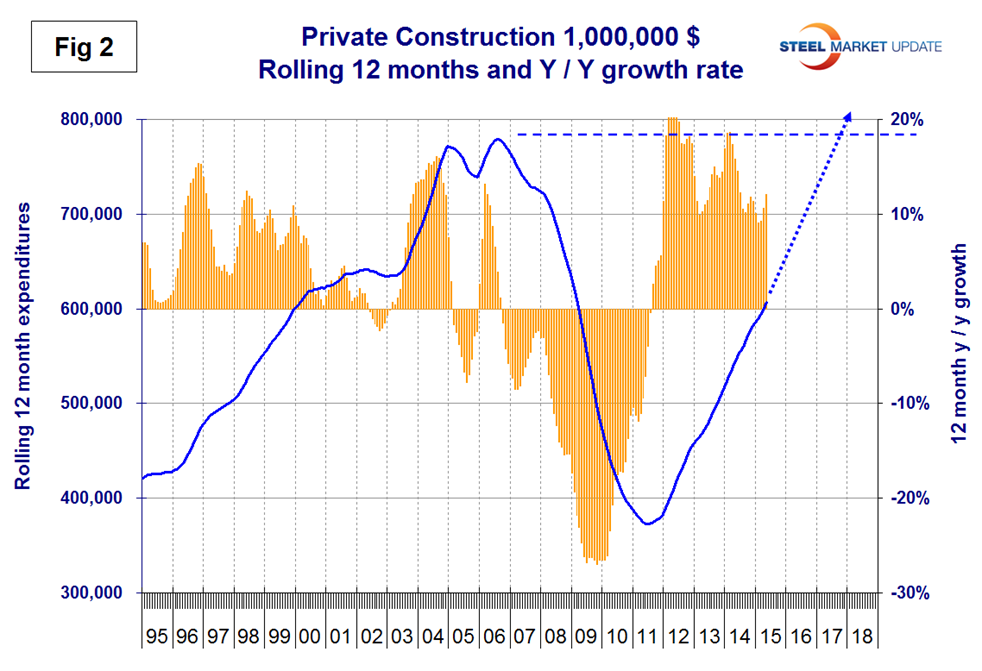
The blue lines in all four graphs in this report are 12 month totals which smooths out seasonal variation. Our analysis of residential construction in this report excludes improvements which are a huge expenditure but which we rationalize as a minimal consumer of steel. Excluding improvements our report shows that both single and multi-family residential continue to have strong y/y growth but both have negative momentum. The single family expenditures reported here have a rate of growth higher than that of single family starts reported by the Census Bureau which have starts growing at 5.6 percent. Starts being lower than the current expenditures we are discussing here suggests a future slowdown. The discrepancy between this CPIP report and starts data for multi-family is huge. In this CPIP report multi-family is growing at 22.9 percent as the multifamily housing starts data from the Census Bureau shows a collapse to 5.5 percent. Note: the housing data published around the 12th of each month reports starts in which the total project cost is entered in the single month of groundbreaking. The good news in the housing data from the Census Bureau is that permits for multi-family improved in May with a growth rate of 14.0 percent. This suggests that the CPIP data for multifamily will decline strongly in the next few months then pick up again as newly permitted projects kick in. Private non-residential buildings grew at a 26.2 percent rate in three months through May y/y with a positive momentum. Within private non-residential, only education buildings had negative y/y growth on a rolling three months basis. About 70 percent of educational buildings are financed by state and local government and this sector had a positive 4.7 percent growth rate. Private commercial buildings, offices, manufacturing, hotels/motels, transportation and recreational continued to have strong year over year growth in three months through May. Religious buildings had positive growth in April and May for the first time since December 2009. For the first time in this report for May we have consolidated private and state and local building construction and categorized by project type. See the end of this report.
State and Local Construction: S&L work expanded by 3.3 percent in the rolling three months through May y/y with a slightly negative momentum, (Table 3).
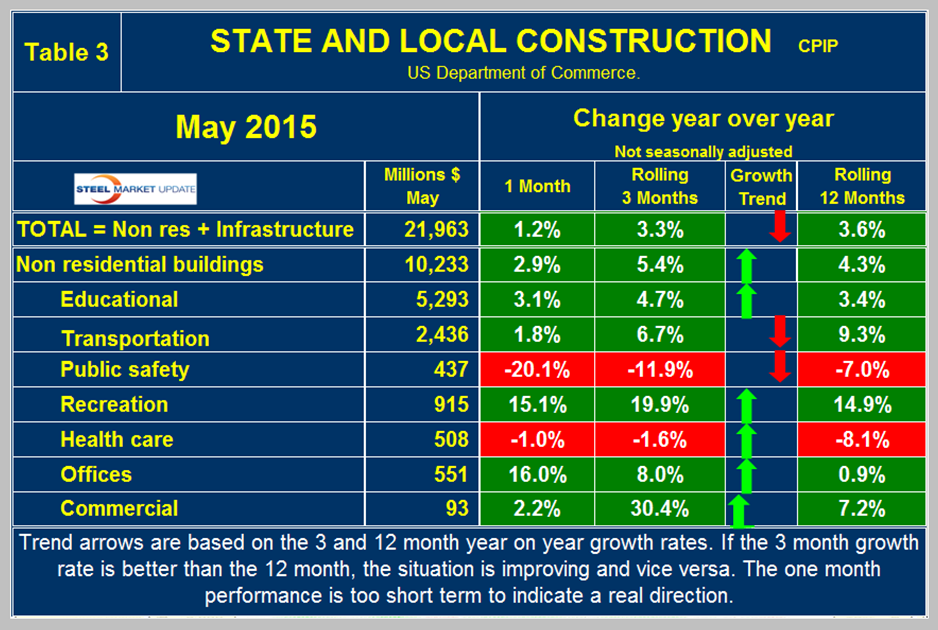
This was the fifteenth consecutive month of positive growth, the first time that has happened in four years. Figure 3 shows year over year growth as the brown bars. S&L non-residential building grew by 5.4 percent y/y with positive momentum.
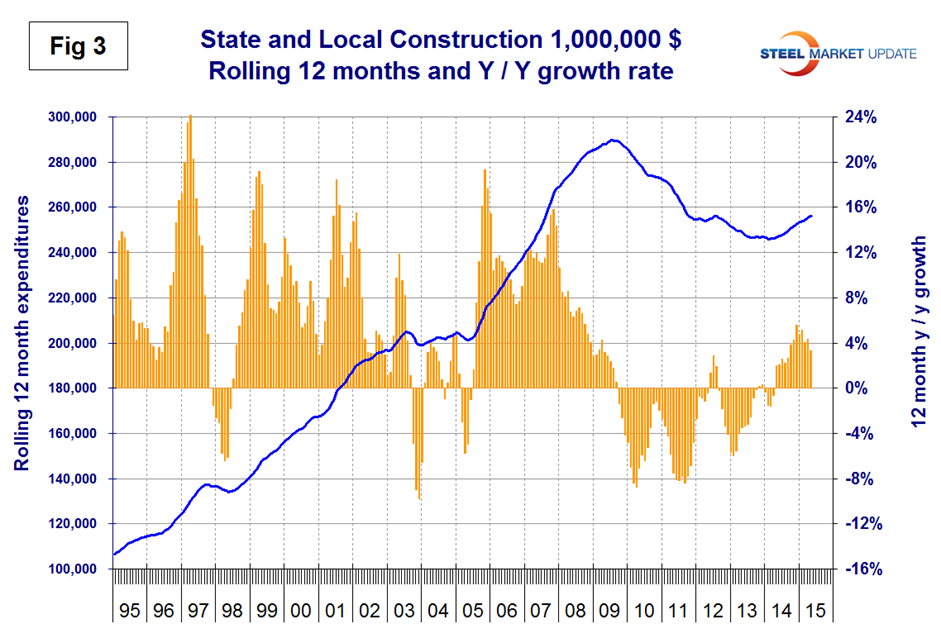
It looks as though state and local governments are beginning to loosen the purse strings as far as construction is concerned. Educational buildings are by far the largest sub sector of S&L non-residential at $5.293 billion in May. Recreational buildings have accelerated markedly in the last six months and grew by 19.9 percent in the latest data. This includes convention centers, sports arenas, theaters and miscellaneous amusements. Public safety buildings which includes jails, police, courthouses and fire stations have had negative growth for 30 straight months. Comparing Figures two and three it can be seen that S&L construction did not have as severe a decline as private work during the recession and that private work is bouncing back faster. Many state and local governments are still far from healthy but a long period of recovery is underway that will take to the end of the decade to reach pre-recession levels.
Drilling down into the private and S&L sectors as presented in Tables 2 and 3 shows which project types should be targeted for steel sales and which should be avoided. There are some project types within S&L that are doing quite well but there are also major regional differences to be considered.
Infrastructure: expenditures have had positive growth in each of the last 21 months through May with a +3.3 percent result in the latest data but with negative momentum. Highway and streets including pavement and bridges accounts for about 2/3 of total infrastructure expenditures and had positive growth for 15 months through February but has contracted each month in the March through May period, (Table 4).
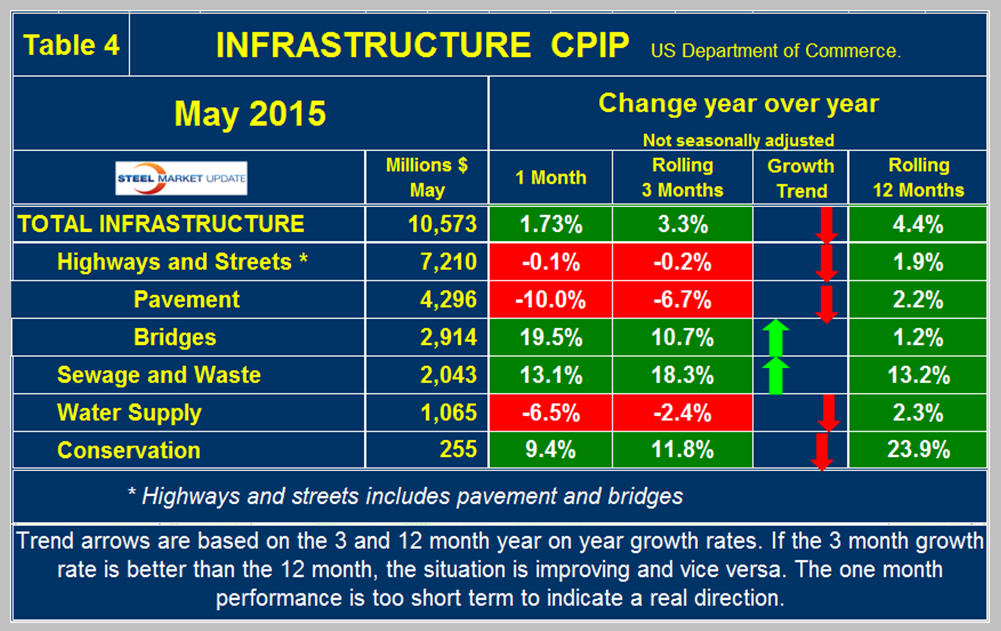
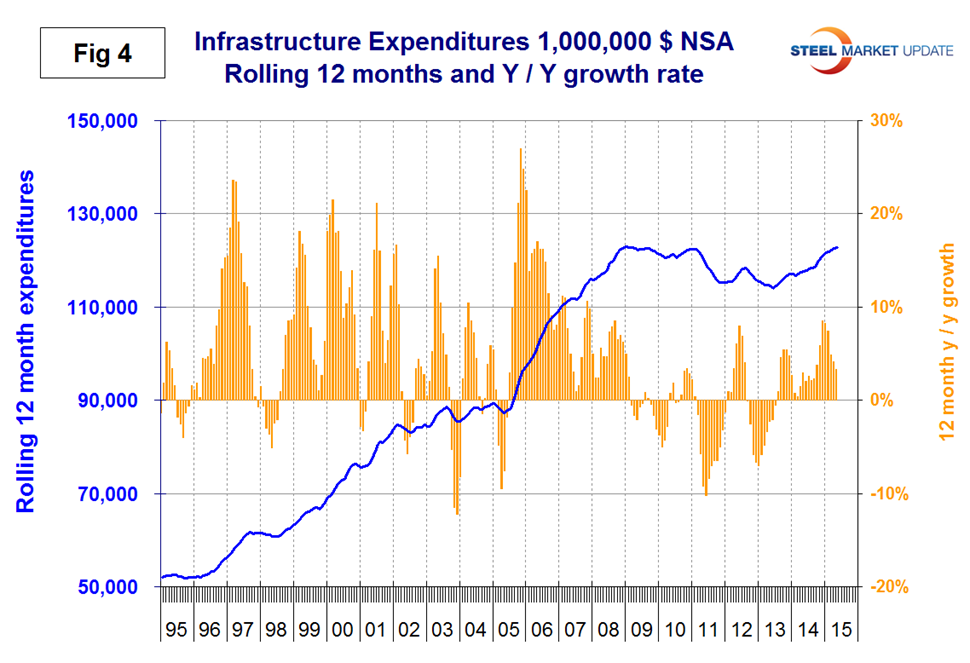
Highway pavement is the main sub-component of highways and streets and had a 6.7 percent negative growth in three months through May following negative 5.0 percent in March and negative 3.9 percent in April. Bridge work contracted every month in Q4 2014 but has since expanded every month this year, (Not a seasonal effect as we are considering year/year data). Bridge work totaled $2.9 billion in the single month of May with a strong 10.7 percent growth rate. Uncertainty about the future of federal funding is likely to last into early next year and this uncertainty results in state governments postponing major projects. That will mean restrained increases in infrastructure starts for both 2015 and 2016. After next year, hopefully, new legislation should combine with improved state finances and innovative approaches to funding surface transportation projects to help lift construction starts more vigorously. Water supply contracted by 2.4 percent in May after 10 straight months of expansion. Based on reports of the critical state of water supply out west this sector is likely to have major growth in the next few years. Conservation expenditures have been surging since November 2013 but the outlays are relatively small. On a rolling 12 month basis, infrastructure expenditures are about where they were four years ago, and have expanded for 21 straight months, (Figure 4).
Total Building Construction Including Residential: Figure 5 compares YTD expenditures for building construction for 2014 and 2015.
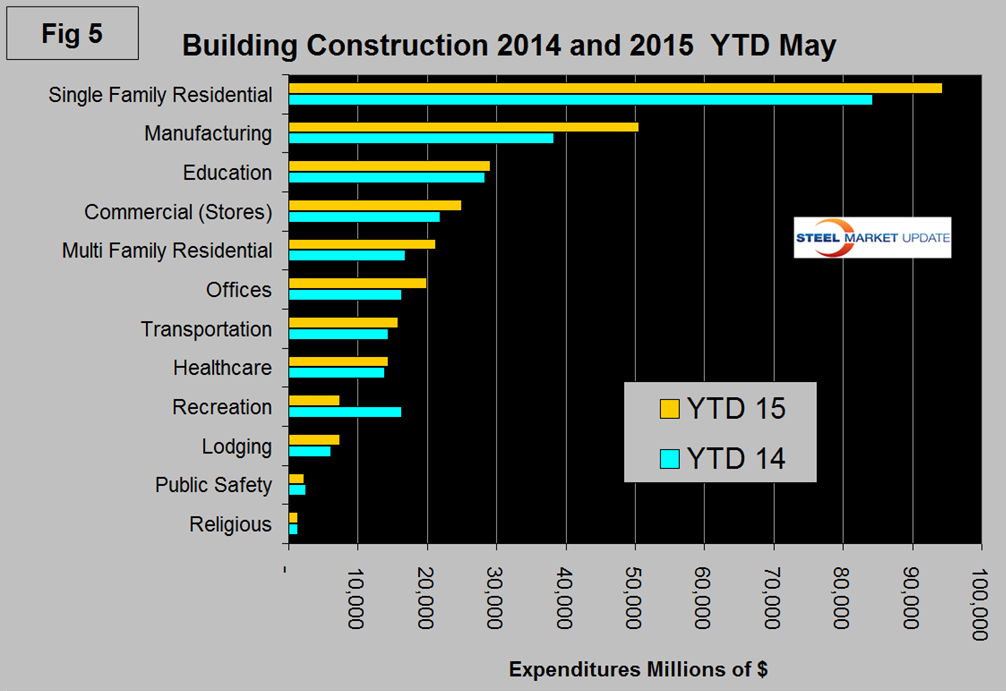
Single family residential is dominant and through May 2015 totaled over $94 billion. On this year over year basis the only sector to be trailing 2014 is recreational buildings and as we saw in our analysis above this sector is catching up.


