

Market Data

July 2, 2015
Net Job Creation through June 2015
Written by Peter Wright
The Bureau of Labor Statistics (BLS) analysis of non-farm employment reported that 223,000 jobs were added in June which was in line with expectations. April and May were revised down by a total of 60,000. Monthly job gains have averaged 221,000 over the past three months. In the 12 months prior to June, employment growth averaged 250,000 per month. The three month moving average (3MMA) of gains through June was 221,000 which was up by 34,000 from May (Figure 1).
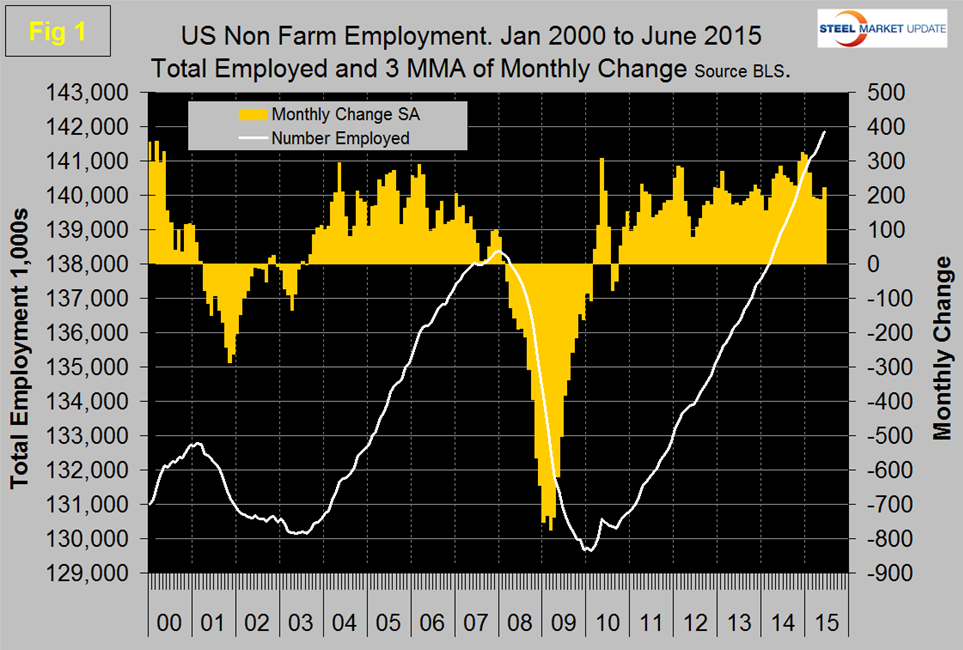
Total non-farm payrolls are now 3,477,000 more than they were at the pre-recession high of January 2008. All numbers in this analysis are seasonally adjusted by the BLS. Average hourly earnings of all employees on private non-farm payrolls were unchanged at $24.95 in June. Over the past 12 months, average hourly earnings have risen by 2.0 percent.
Table 1 slices total employment into service and goods producing industries and then into private and government employees.
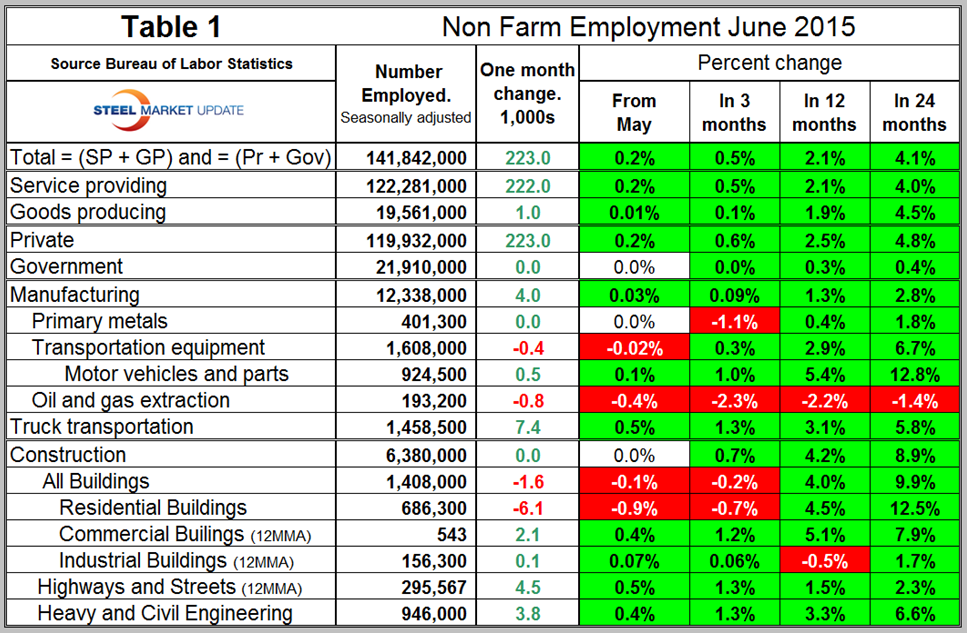
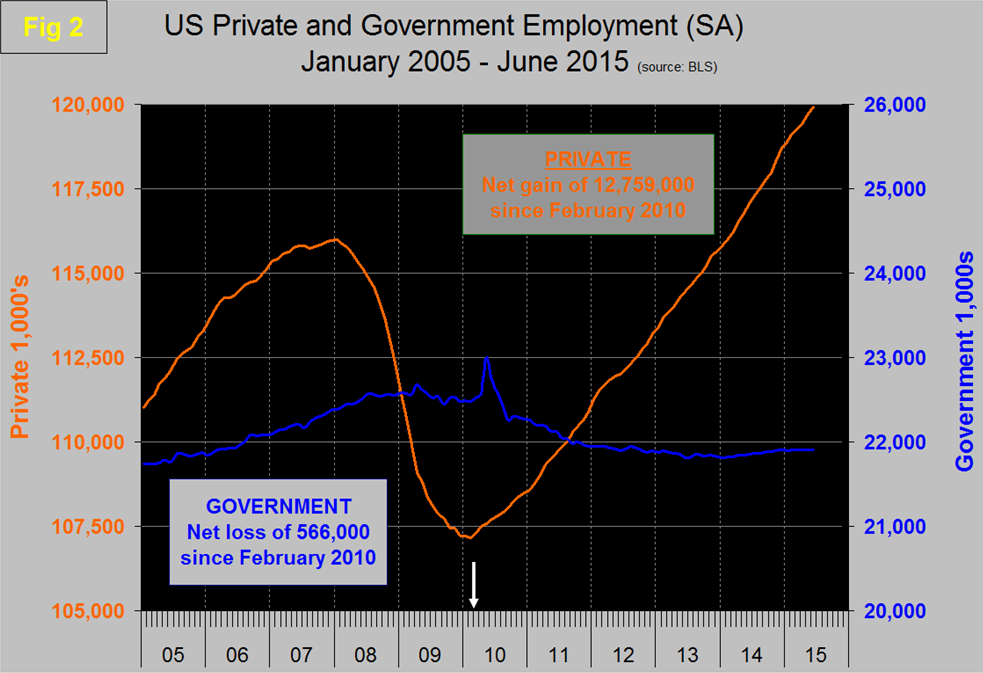
Total employment equals the sum of private and government employees. It also equals the sum of goods producing and service employees. Most of the goods producing employees work in manufacturing and construction and the major components of these two sectors are also shown in Table 1. In June all the employment growth was in the private sector with zero growth in government. Since February 2010, the employment low point, private employers have added 12,759,000 as government has shed 566,000 (Figure 2).
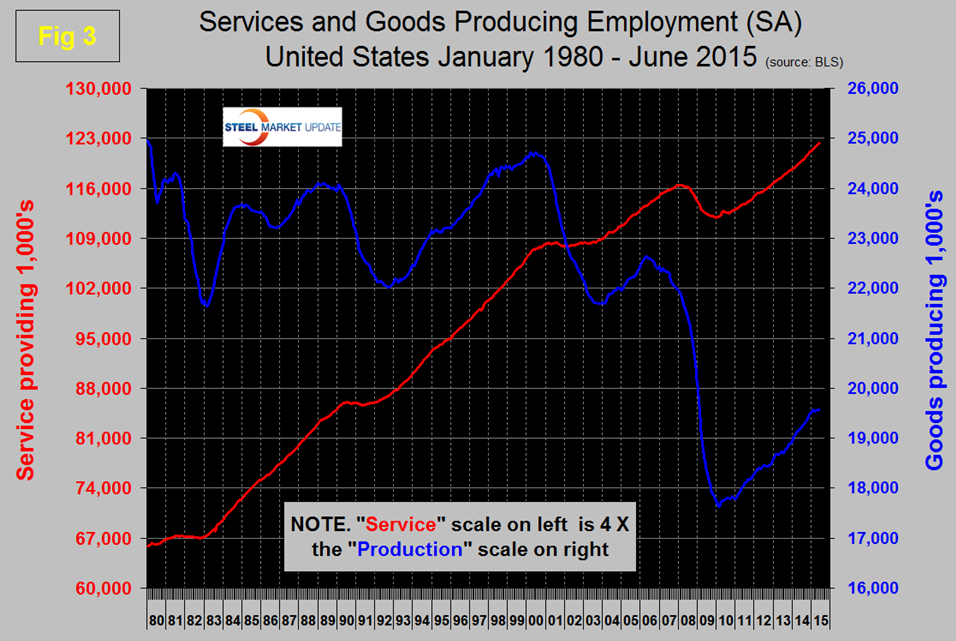
In June, service industries expanded by 222,000 and goods producing by only 1,000 people. Since February 2010, service industries have added 10,259,000 and goods producing 1,934,000 positions (Figure 3).
Returning to Table 1 we see that manufacturing added only 4,000 jobs in June and has added only 16,000 in the last four months. Primary metals added zero jobs in June and transportation equipment shed 400 jobs. Note: Table 1 only identifies the major sectors in manufacturing and construction so the totals don’t add up. Truck transportation added 7,400 jobs and is now past the pre-recessionary peak of January 2007. Oil and gas extraction after a delayed response to reduced energy prices is now showing up in this latest report as a looser with employment level 2.2 percent less than a year ago. Construction added zero jobs in June, down from 30,000 in April and 15,000 in May. Note all these numbers are seasonally adjusted by the BLS. Since the bottom of the employment recession, construction and manufacturing are running neck and neck in job creation. Construction has added 880,000 jobs and manufacturing 885,000 since the recessionary employment low point in February 2010 (Figure 4).
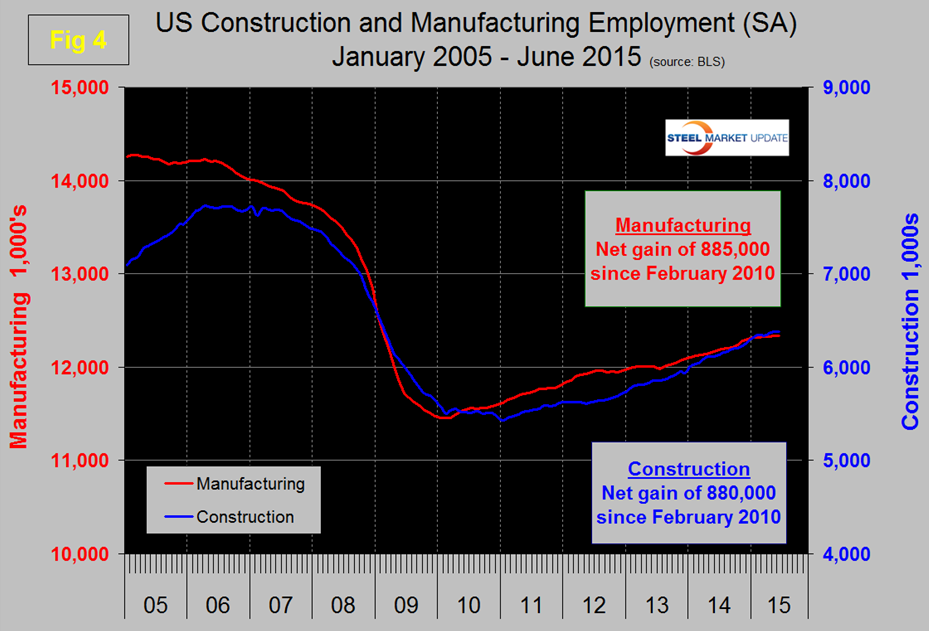
Based on the total construction analysis that we reported earlier this week we assume that the current BLS employment report is an aberration and that construction jobs will pick up again through the summer. Construction has been holding back steel demand but that should increasingly not be the case.
The official unemployment rate decreased from 5.5 percent in May to 5.3 percent in June. This number known as the U3 rate doesn’t take into consideration those who have stopped looking. The more comprehensive U6 unemployment rate decreased from 10.8 percent in May to 10.5 in June (Figure 5).
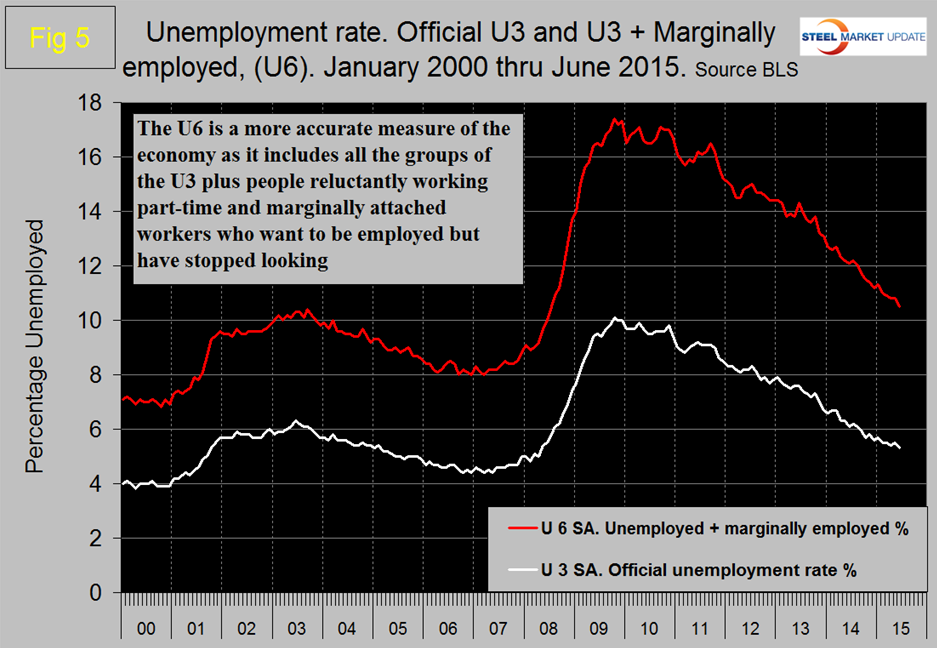
U6 includes workers working part time who desire full time work and people who want to work but are so discouraged that they have stopped looking. The differential between these rates was usually less than 4 percent before the recession but is still 5.2 percent. The good news is that the gap is slowly closing.
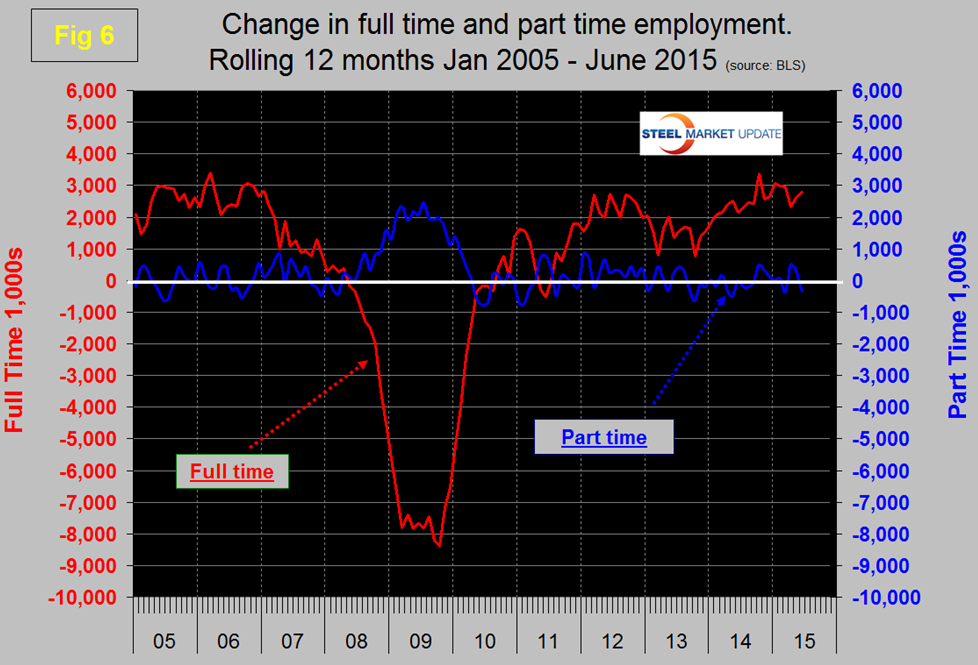
So far in 2015 there has been an increase of 1,119,000 full time jobs and 161,000 part time jobs. Figure 6 shows the rolling 12 month total change in both part time and full time employment.
The job openings report known as JOLTS is reported on about the 10th of the month by the Federal Reserve and is a month in arrears so April data came out on June 10th. Figure 7 shows the history of unfilled job openings since January 2001 and that openings have skyrocketed this year.
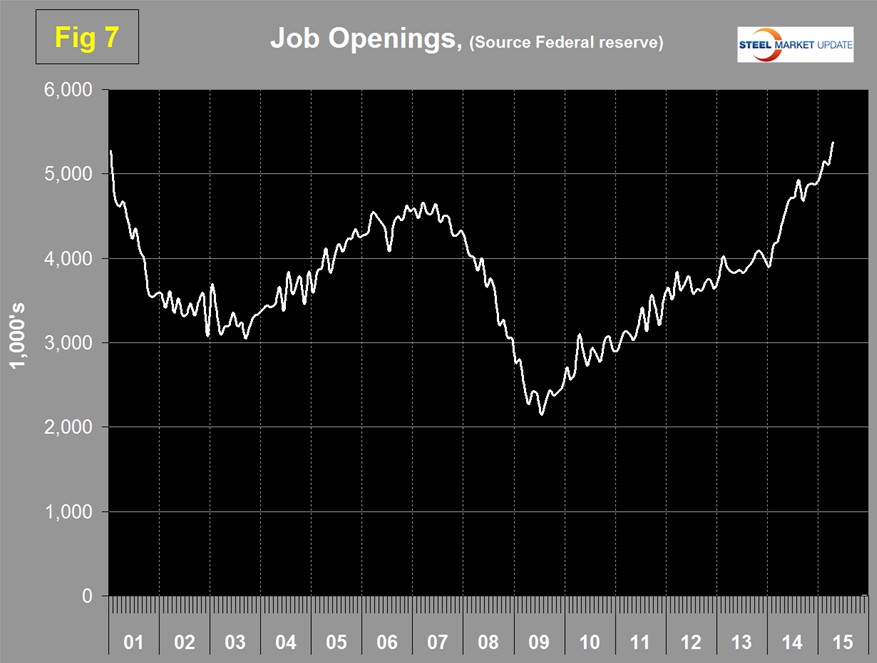
Armada Executive Intelligence reported as follows last month; “the JOLT report that covers job openings, losses, terminations, and quits was released today and we saw the openings figure “skyrocket” to highs not seen since the data has been accumulated. The previous high was 5.25 million in 2000; we just surged from 4.9 million to nearly 5.4 million in today’s report. Our friends at TranSystems pointed out to us that there is a 1:1.5 ratio between the total number of people looking for jobs and the numbers of jobs available to them. That’s significantly higher than at any point since hitting 1:7 at the height of the financial crisis in 2009. In 2006 when we can argue that the economy was “humming” and almost overheating, we saw a ratio of about 1:1.4. The lowest rate prior was hit in 2001 of about 1:1.1. It’s a matter of demographics. Again, there are too many people leaving the workforce and not enough with the right training or motivation to work to fill vacancies. And, with Baby Boomers hitting age 65 at the rate of 10,000 a day, these numbers should get worse over the next decade.”
SMU Comment: We are living in what is increasingly a service economy. Service industries including government have added 1,178,000 jobs in the first half of 2015 compared to only 72,000 in goods producing which is mainly manufacturing and construction. The labor force participation rate declined by 0.3 percentage point to 62.6 percent in June. The employment-population ratio was essentially unchanged in June at 59.3 percent and has shown little movement thus far in 2015.


