

Analysis

July 20, 2015
Housing Starts and Permits through June and Builder Confidence in July
Written by Peter Wright
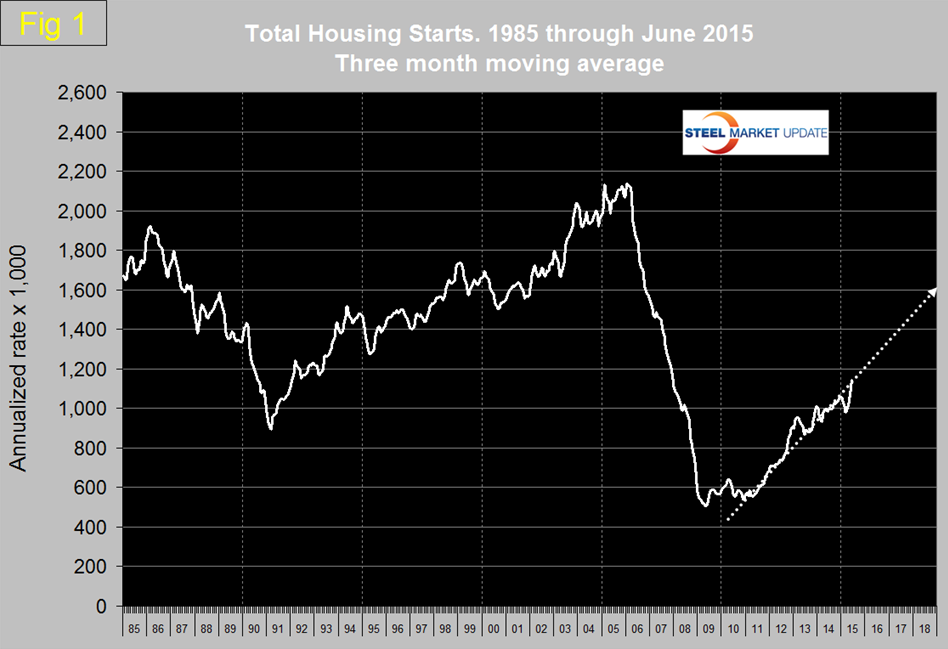
We had begun to think that our projection for total housing starts to reach 1.6 million units annualized by the end of 2018 was optimistic but the June report put that projection back on track. Total starts in June were at an annual rate of 1,174,000 with a three month moving average (3MMA) of 1,144,000. The 3MMA increased from 1,071,000 in May (Figure 1).
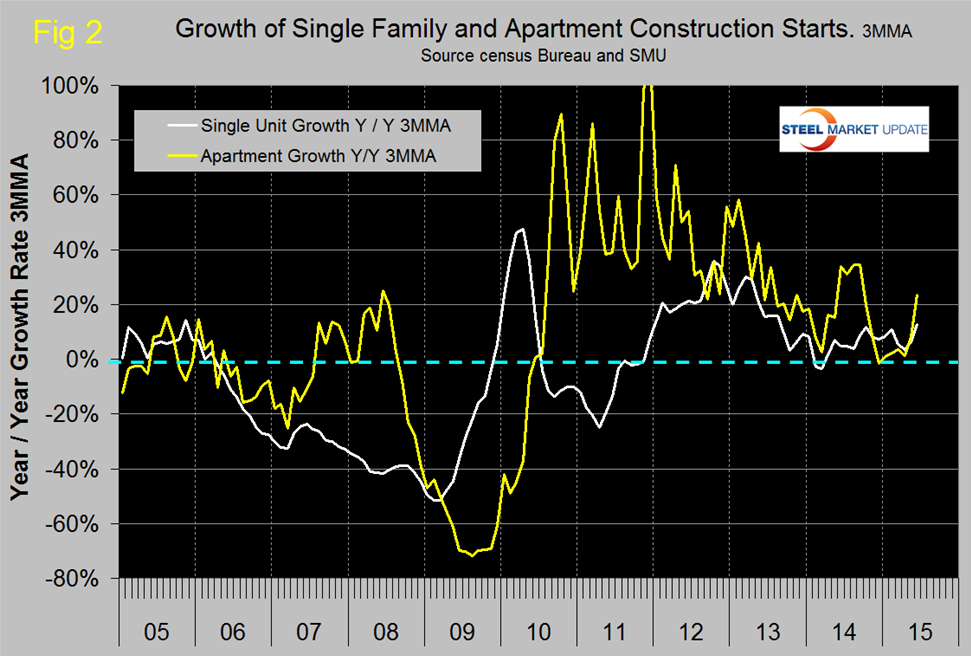
On that basis, single family at 704,000 was up by 3.0 percent month over month and up by 12.7 percent year over year (y/y) but is still 62.4 percent below the peak of late 2005. This was the best y/y growth rate of single family since August 2013. Multifamily (apartments and condominiums) was up by 14.8 percent m/m and by 23.5 y/y. The Census department results are seasonally adjusted and the monthly numbers are annualized.
Multifamily starts had lack-luster growth for seven months prior to June but this latest data, driven significantly by apartment construction in New York returned, to the level last seen in October last year (Figure 2).
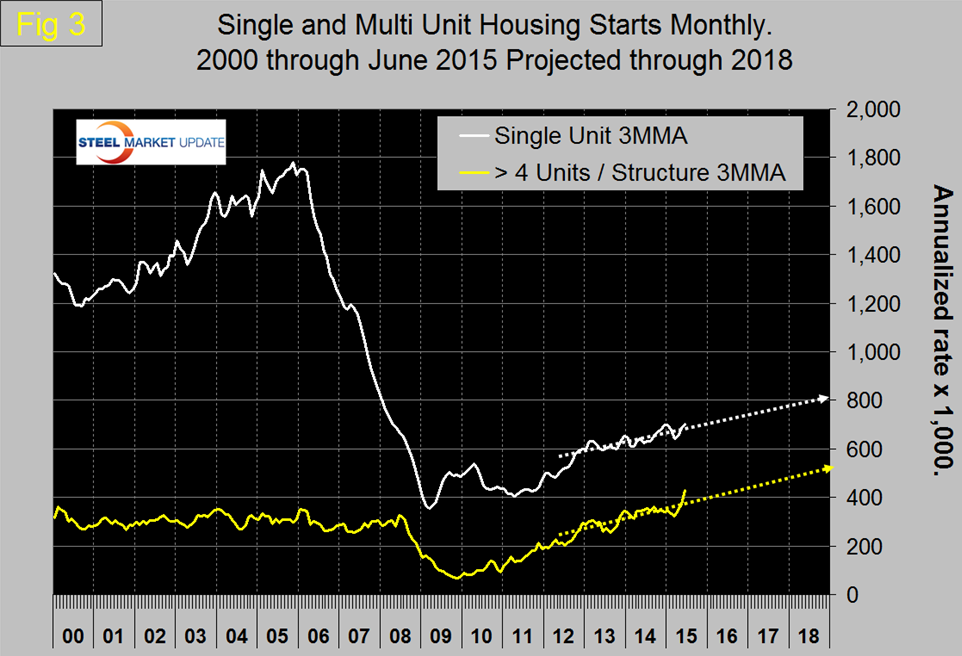
The growth rate of single family y/y at 12.7 percent was only the third month of double digit growth since August 2013. Figure 3 shows the trajectory of single family and apartments.
Permit data is useful as a forward look at starts. If permits exceed starts then we anticipate an acceleration in construction starts and vice versa. Total permits have increased each month since March and reached 1,343,000 in June with a 3MMA of 1,244,000 annualized. Permits were up by 8.9 percent from May and by 19.5 percent y/y. There is a much wider divergence than normal between permits and starts (Figure 4).
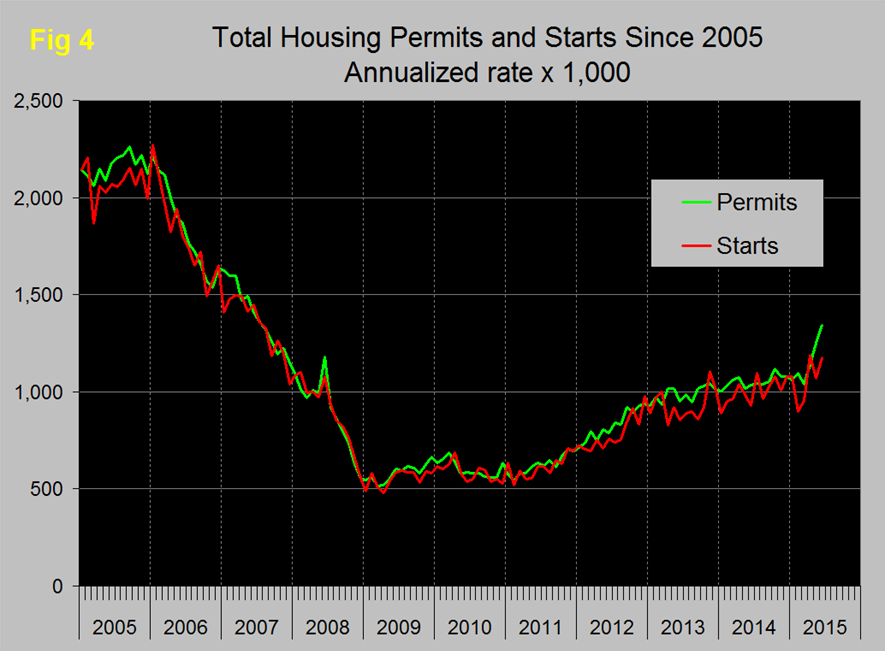
As mentioned above regarding starts, the divergence was strongly influenced by some very large apartment projects in New York.
Table 1 shows total permits and starts nationally and regionally.
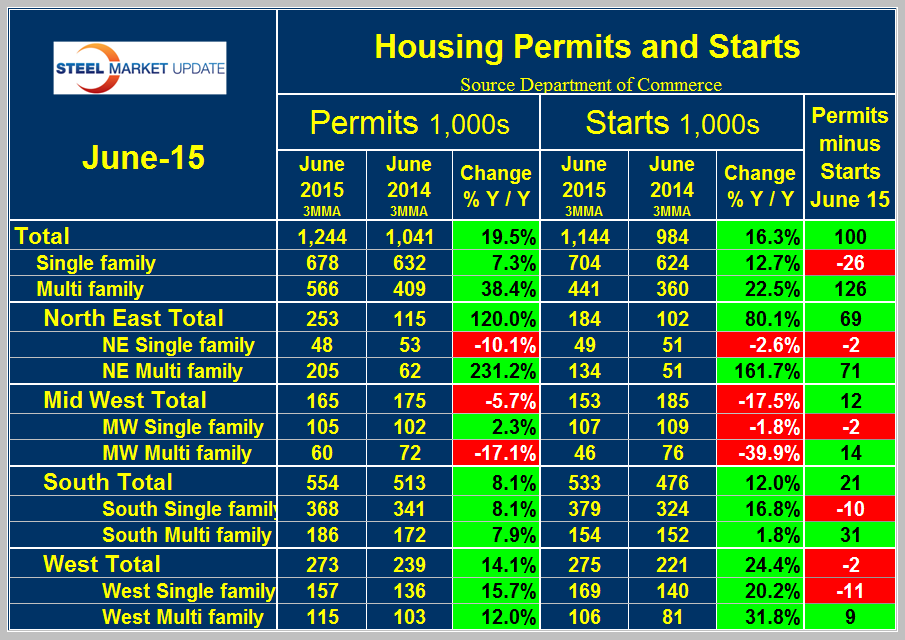
At the national level the differential between permits and starts for single and multi-family units is suggesting that the shift in consumer’s preference towards apartments is far from over. In June on a 3MMA basis, permits of multi-family exceeded starts by 126,000 in contrast to the negative 26,000 for single family. In total permits were 100,000 more than starts which was an almost exact repeat of the April and May results. The differential between permits and starts for multi and single family units was the same across all regions with permits for multifamily exceeding starts and permits for single family were being less than starts. The implication is that apartment construction is poised to surge strongly and that single family construction will slow slightly. The ratio of the two sectors is shown in Figure 5 and demonstrates that single family homes continue to be less desirable than at any time since March 1974.
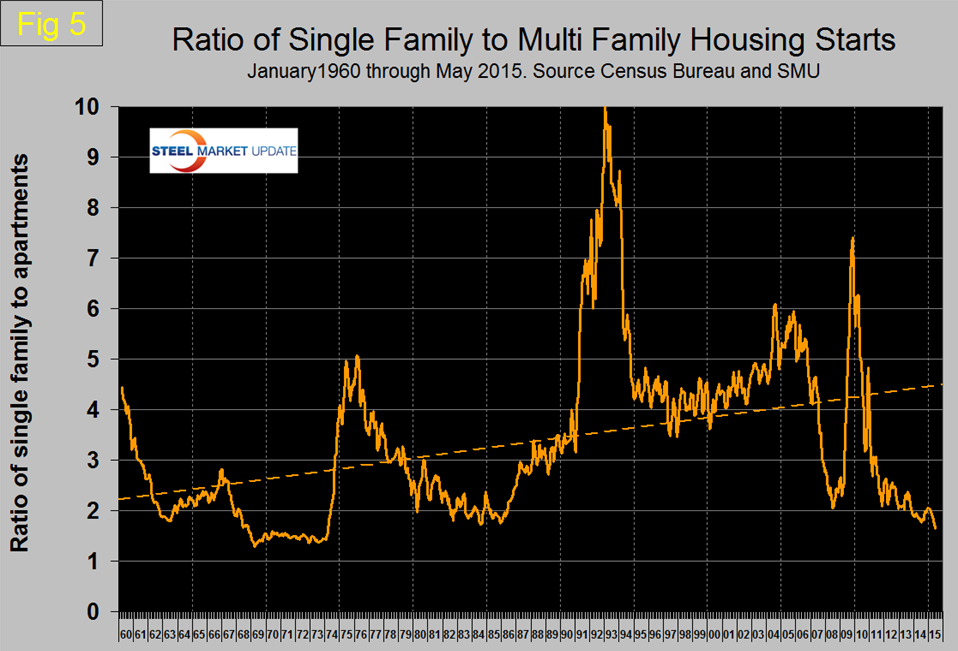
Based on permit data the ratio will not change any time soon. In addition to the drivers we have mentioned in past housing updates, student loan debt, desire for mobility and poor perception of a house as an investment there is a generational influence that promotes the idea of rent in preference to purchase. Housing is influenced by the fact that the very large millennial generation is reaching prime home buying age. And exactly as with Boomers 50 years ago, the first part of the housing market to benefit is apartments and condos. Also millennials are postponing marriage and prefer an urban to suburban lifestyle. Another factor that may be slowing the recovery in new home sales is the retirement of the boomers. The year 2010 marked the official start of the boomer retirements. The over 65 age group new home purchases typically are moves to downsize and often are moves to town homes or condominiums versus single-family homes. Over the next 35 years, many in the boomer generation will be selling their larger single-family homes and downsizing to smaller homes or multi-unit dwellings.
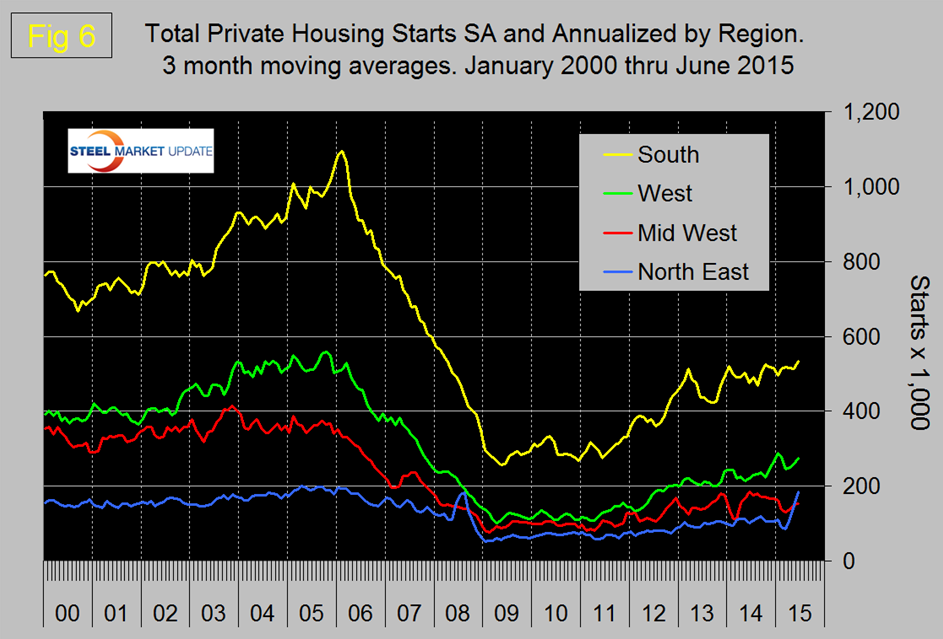
Figure 6 shows the regional situation for the 3MMA of total residential starts since February 2000. In 2015 the North East has the highest growth rate.
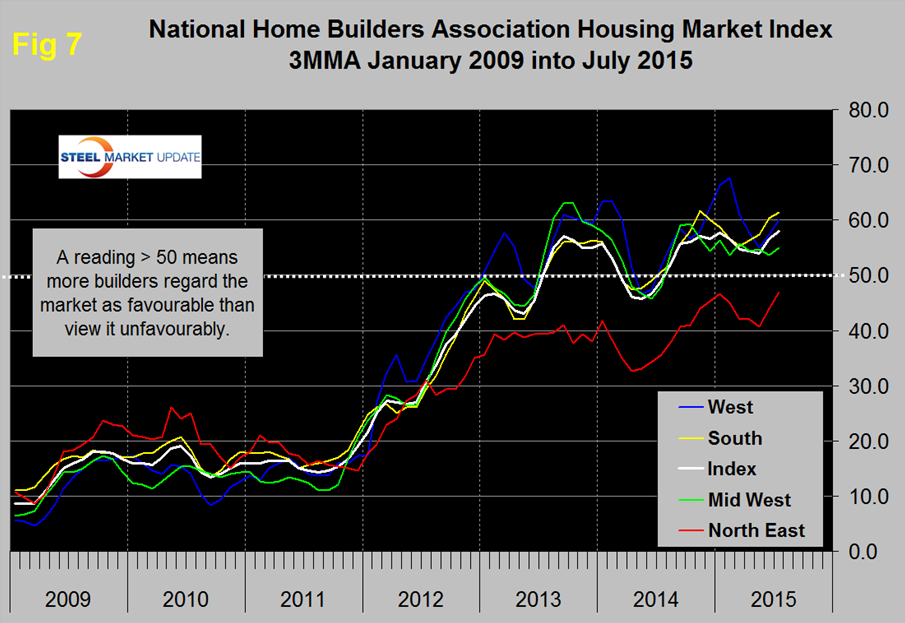
The National Association of Home Builders (NAHB) confidence report was released on Thursday. Any value above 50 indicates an overall positive business confidence. All regions enjoyed an increase in confidence on a three month moving average basis (Figure 7). The South continues to be the strongest region.
The official release from the NAHB was as follows:
Builder Confidence Hits Highest Level Since November 2005
Builder confidence in the market for newly built, single-family homes in July hit a level of 60 on the National Association of Home Builders/Wells Fargo Housing Market Index (HMI) released today while the June reading was revised upward one point to 60 as well. The last time the HMI reached this level was in November 2005.
“The fact that builder confidence has returned to levels not seen since 2005 shows that housing continues to improve at a steady pace,” said NAHB Chairman Tom Woods, a home builder from Blue Springs, Mo. “As we head into the second half of 2015, we should expect a continued recovery of the housing market.”
“This month’s reading is in line with recent data showing stronger sales in both the new and existing home markets as well as continued job growth,” said NAHB Chief Economist David Crowe. “However, builders still face a number of challenges, including shortages of lots and labor.”
Derived from a monthly survey that NAHB has been conducting for 30 years, the NAHB/Wells Fargo Housing Market Index gauges builder perceptions of current single-family home sales and sales expectations for the next six months as “good,” “fair” or “poor.” The survey also asks builders to rate traffic of prospective buyers as “high to very high,” “average” or “low to very low.” Scores for each component are then used to calculate a seasonally adjusted index where any number over 50 indicates that more builders view conditions as good than poor.
Two of the three HMI components posted gains in July. The component gauging current sales conditions rose one point to 66 and the index charting sales expectations in the next six months increased two points to 71. Meanwhile, the component measuring buyer traffic dropped a single point to 43.
Looking at the three-month moving averages for regional HMI scores, the West and Northeast each rose three points to 60 and 47, respectively. The South and Midwest posted respective one-point gains to 61 and 55.
Editor’s Note: The NAHB/Wells Fargo Housing Market Index is strictly the product of NAHB Economics, and is not seen or influenced by any outside party prior to being released to the public.


