Market Data

July 27, 2015
Regional Job Creation through Q2 2015
Written by Peter Wright
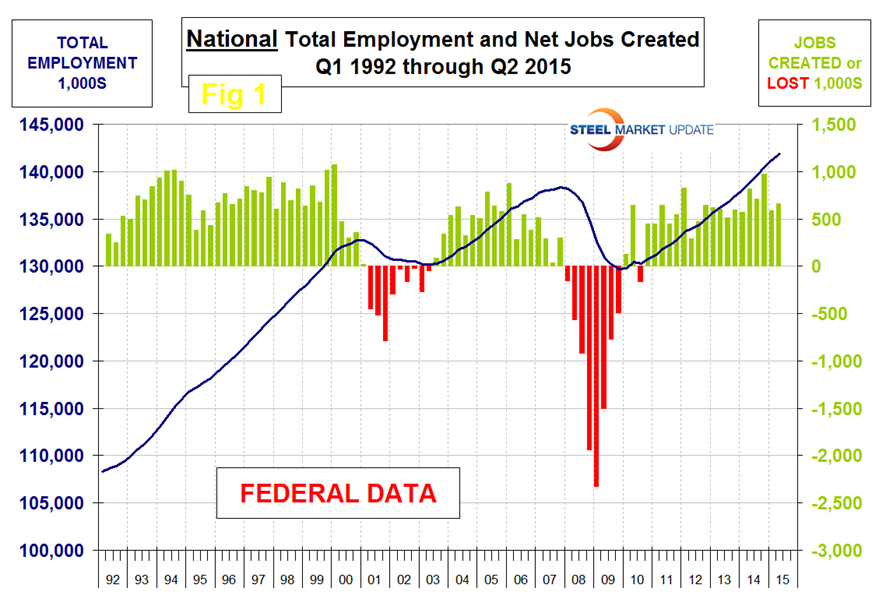
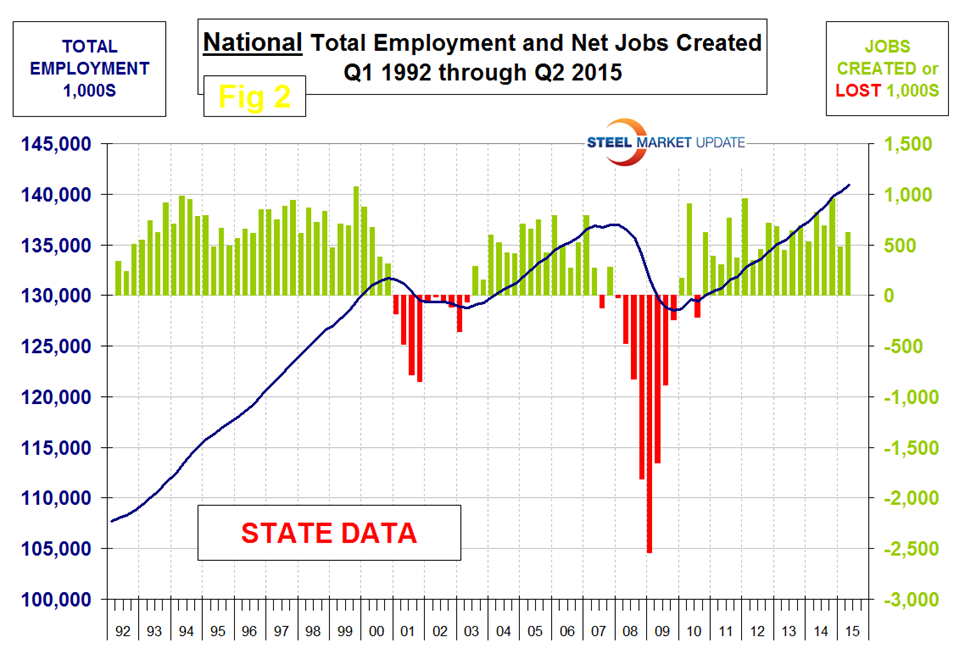
The states compile their employment numbers independently of the Feds then both are reported by the Bureau of Labor Statistics. The results are very close. In the last six quarters since Q1 2014, the Feds reported total job creation of 4,320,000 and the states reported 4,093,000. Figure 1 and Figure 2 show the history of Federal and State totals since 1992.
SMU has graphs in the same format for 10 geographic regions and can produce for individual states if a reader so requests.
Table 1 shows the history of quarterly job creation by region for the last 4.5 years.
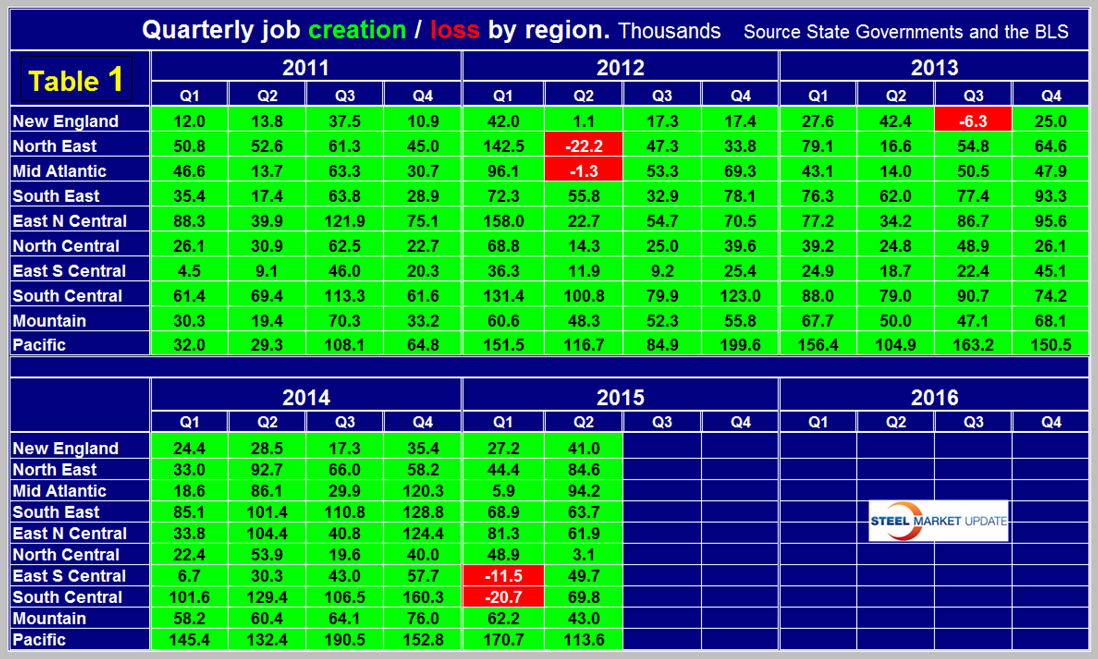
All regions had positive job creation in Q2 led by the Pacific with 113,600 and trailed by the North Central with 3,100. The NC region consists of IA, KS, MN, MO, NE, ND and SD. The NC region was dragged down by Nebraska and North Dakota which lost 7,700 and 4,700 jobs respectively. States with the best performance in Q2 were New York with 49,700, Florida with 49,800, Texas with 49,700 and California with 86,400. From an energy point of view, Texas has bounced back due to its diversified economy but North Dakota has not.
The regions have fared very differently since the pre-recession high of Q1 2008 and since the low point of Q4 2009. There are now 3,911,000 more people employed than there were immediately before the recession but of that number a third were created in the South Central (TX, LA, AR and OK). The East South Central (AL, KEN, MIS, and TEN) is the only region not to have surpassed the pre-recession number of people employed but are almost at that point (Table 2).
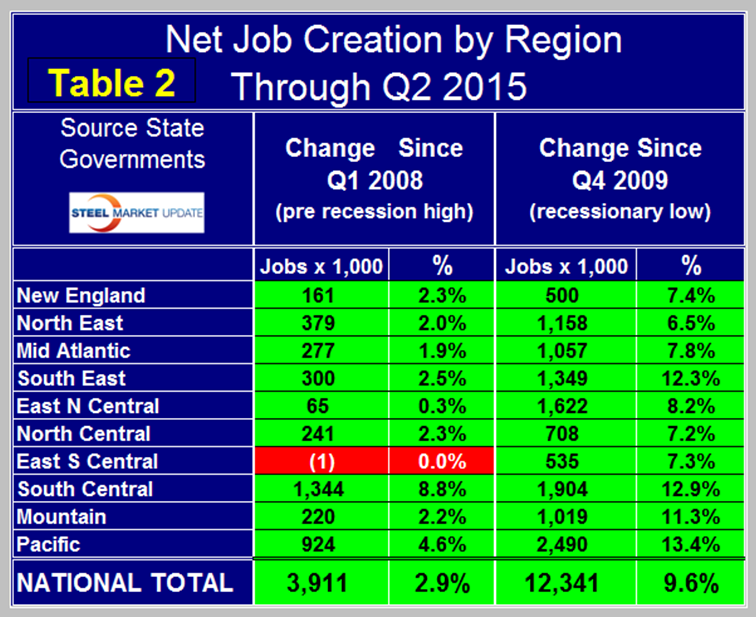
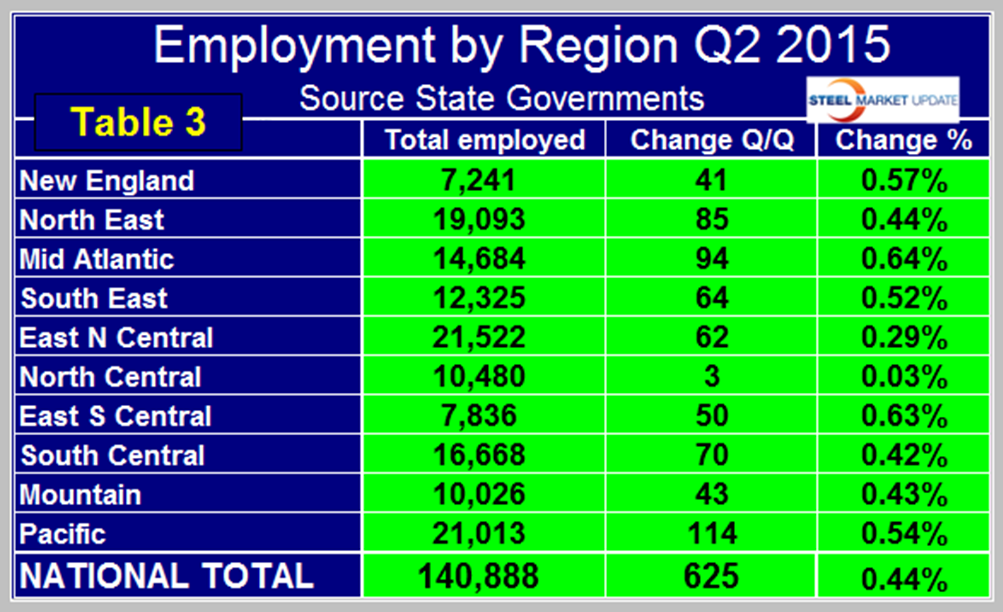
Employment is now 12,341,000 positions higher than it was at the low point of the recession. The Pacific has had the largest number of jobs created during the recovery with an increase of 2,490,000 new positions which amounts to 13.4 percent of total employment. The South Central is in second place with 1,904,000 jobs created which is 12.9 percent of total employment. The East North Central (IL, IN, MI, OH and WI) currently has the highest number of employed people with 21,522,000, followed by the Pacific with 21,013,800 (Table 3).