

Analysis

August 4, 2015
Construction Expenditures (CPIP) Through June
Written by Peter Wright
Each month the Commerce Department issues its Construction Put in Place (CPIP) data, usually on the first working day covering activity two months earlier. June data was released on Monday August 2nd.
![]() Construction Put in Place is based on spending work as it occurs, estimated for a given month from a sample of projects. In effect the value of a project is spread out from the project’s start to its completion. Construction starts data published by the Commerce Department for residential construction and by Dodge Data & Analytics and Reed Construction for non-residential is completely different as in these cases the whole project is entered to the data base when ground is broken. This results in the starts data being extremely spiky which is not the case with CPIP.
Construction Put in Place is based on spending work as it occurs, estimated for a given month from a sample of projects. In effect the value of a project is spread out from the project’s start to its completion. Construction starts data published by the Commerce Department for residential construction and by Dodge Data & Analytics and Reed Construction for non-residential is completely different as in these cases the whole project is entered to the data base when ground is broken. This results in the starts data being extremely spiky which is not the case with CPIP.
The official CPIP press report gives no appreciation of trends on a historical basis and merely compares the current month with the previous one on a seasonally adjusted basis. The detail is hidden in the published data tables which we at SMU dissect to provide a long term perspective. Our intent is to provide a rout map for those subscribers who are dependent on this industry to “Follow the money.” This is a very broad and complex subject therefore to make this monthly write up more comprehensible we are keeping the information format as consistent as possible. Data is reported by the Commerce Department on both a seasonally adjusted and non-adjusted basis. Their official commentary is based on adjusted numbers. In the SMU analysis we consider only the non-seasonally adjusted data and get rid of seasonal effects by comparing three month expenditures year over year.
In the four tables below we present the non-seasonally adjusted expenditures for the most recent month of data. Growth rates presented are all year over year and are the rate for the single months result, the rolling 3 months and the rolling 12 months. The arrows indicate momentum. If the rolling 3 month growth rate is stronger than the rolling 12 months we define this as positive momentum and vice versa. In the text below when we refer to growth rate we are describing the rolling 3 months year over year rate. In Figures 1 through 4 below the blue lines represent the rolling 12 month expenditures and the brown bars represent the rolling 3 month year over year growth rates.
Total Construction: The June CPIP report was nothing short of excellent and April and May expenditures were revised upwards. The Associated general Contractors of America had this to say on August 2nd:
“Construction spending in June recorded the highest year-over-year growth rate since 2006, Spending rose strongly in June from a year ago for all major construction categories—private nonresidential, residential and public,” said Ken Simonson, the association’s chief economist. Totals for May and April were revised upward by large amounts. Construction spending in June totaled $1.065 trillion at a seasonally adjusted annual rate, 12 percent higher than in June 2014, Simonson said. He noted that the year-over-year growth rate was the strongest since March 2014, indicating a faster pace of construction spending overall. The June total was the highest level since July 2008 and was 0.1 percent higher than the May total following an upward revision of $28 billion in that figure. The April total was also revised higher, by $18 billion. Association officials cautioned, however, that those spending gains could be at risk unless all levels of government strengthen programs to develop the construction workforce.”
June expenditures were $865.6 billion which breaks down to $57.3 B of private work, $26.4 B of state and locally (S&L) funded work and $1.9 B of federally funded (Table 1).
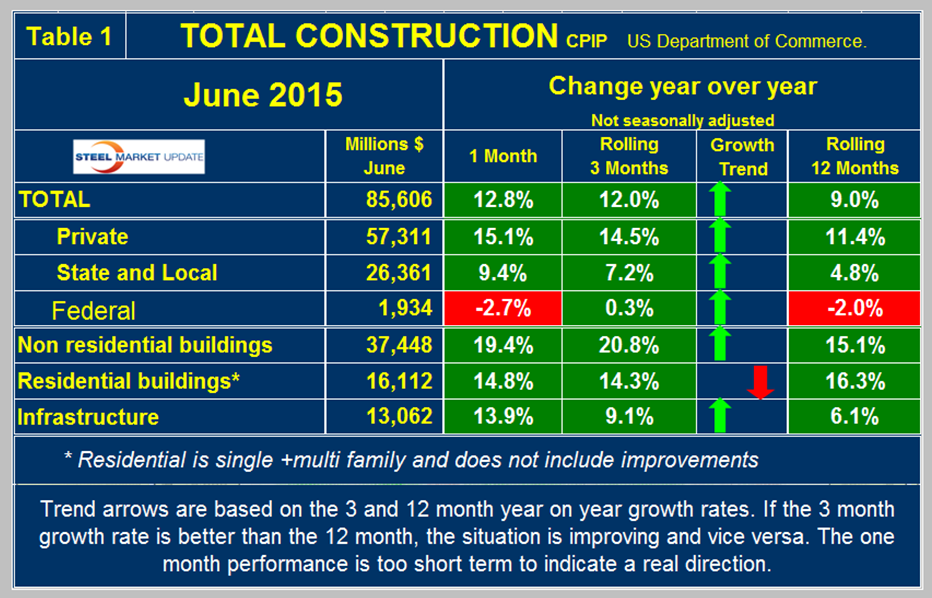
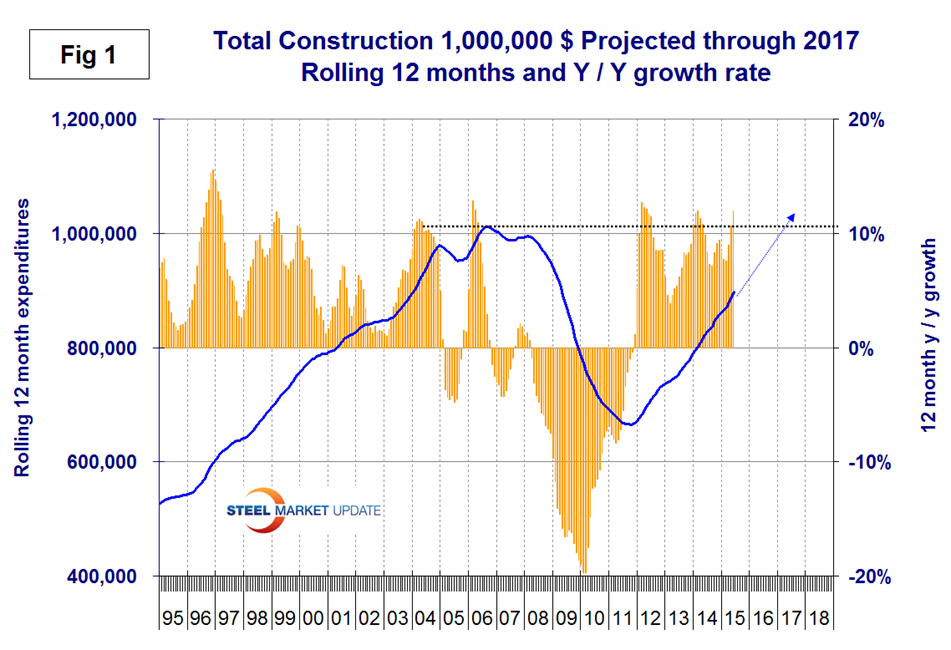
The projected date at which total construction will reach the pre-recession level was Q2 2017 in our last update but if the June performance is sustained then that extrapolation will shorten considerably. On a rolling three month basis y/y total construction was up by 12.0 percent led by private work up by 14.5 percent. Total construction growth is accelerating since the short term growth (3 months 12.0 percent) is higher than the long term (9.0 percent). We report this as positive momentum. Note this is not a seasonal effect because our y/y analysis removes seasonality. All three categories, private, S&L and federal had positive momentum in the June report. We consider three sectors within total construction. These are non-residential, residential and infrastructure. The growth rate of non-residential buildings is a very high at 20.8 percent and accelerating. Residential is growing at 14.3 percent and has been slowing for 26 straight months. Infrastructure grew 9.1 percent in three months through June year over year with positive momentum. The growth rate of total construction slowed in the first three months of this year but improved in April, May and June as shown by the brown bars in Figure 1.
The pre-recession peak of total construction on a rolling 12 month basis was $1,145 B in 12 months through February 2007. The low point was $665.1 B in 12 months through October 2011. The 12 month total through the latest data of June 2015 was $898 B.
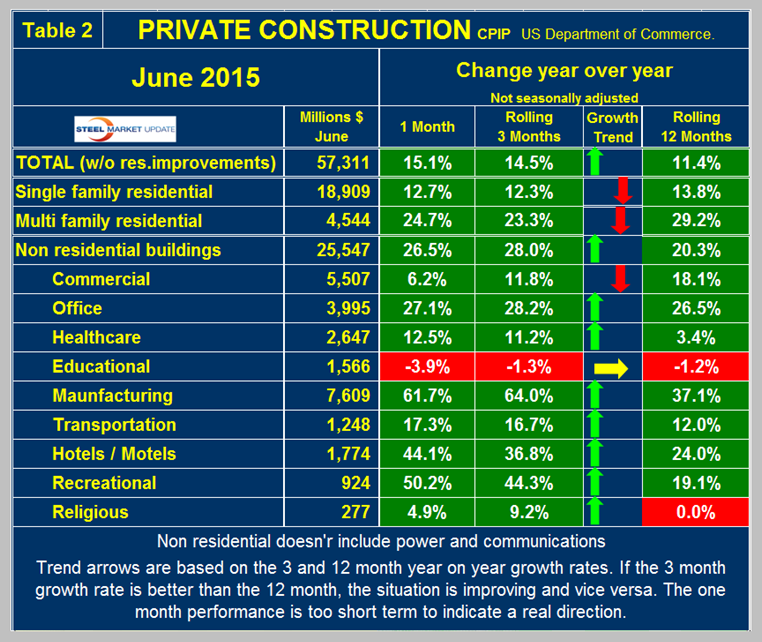
Private Construction: Table 2 shows the breakdown of total private expenditures into residential and non-residential and subsectors of both.
The growth rate of private construction was 14.5 percent in the last three months as shown by the brown bars in Figure 2.
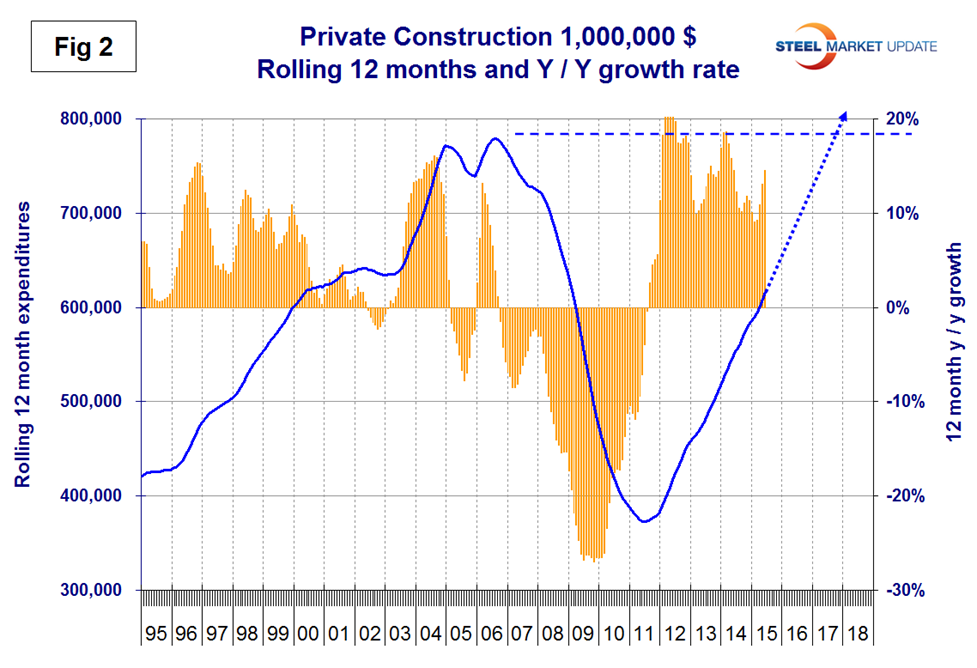
The blue lines in all four graphs in this report are 12 month totals which smooths out seasonal variation. Our analysis of residential construction in this report excludes improvements which are a huge expenditure but which we rationalize as a minimal consumer of steel. Excluding improvements our report shows that both single and multi-family residential continue to have strong y/y growth but both have negative momentum. The single family expenditures reported here have a rate of growth very similar to that of single family starts reported by the Census Bureau which have starts growing at 12.7 percent. Starts being similar to current expenditures we are discussing here suggests growth stability going forward. The growth of multifamily expenditures in this CPIP report is also almost exactly the same as construction starts of this sector reported by the Census Bureau. In this CPIP report multi family is growing at 23.3 percent as the multifamily housing starts data from the Census Bureau is growing at 23.5 percent. Note: the housing data published around the 12th of each month reports starts in which the total project cost is entered in the single month of groundbreaking. Private non-residential building expenditures grew at a 28.0 percent rate in three months through June y/y with a positive momentum. Within private non-residential, only education buildings had negative y/y growth on a rolling three months basis. About 70 percent of educational buildings are financed by state and local government and the educational sector as a whole grew at 4.0 percent. All segments of private commercial buildings except religious had double digit growth in this latest data. Religious buildings had positive growth in April, May and June for the first time since December 2009.
State and Local Construction: S&L work expanded by 7.2 percent in the rolling three months through June y/y with positive (Table 3).
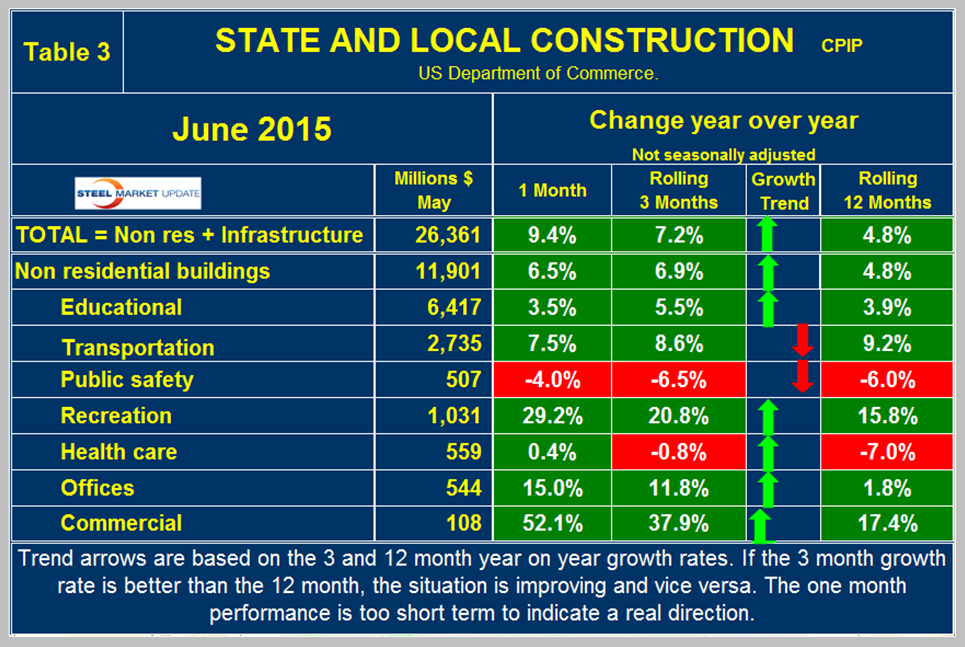
This was the highest rate of growth for S&L since March 2008 and was the sixteenth consecutive month of positive growth, the first time that has happened in four years. Figure 3 shows year over year growth as the brown bars.
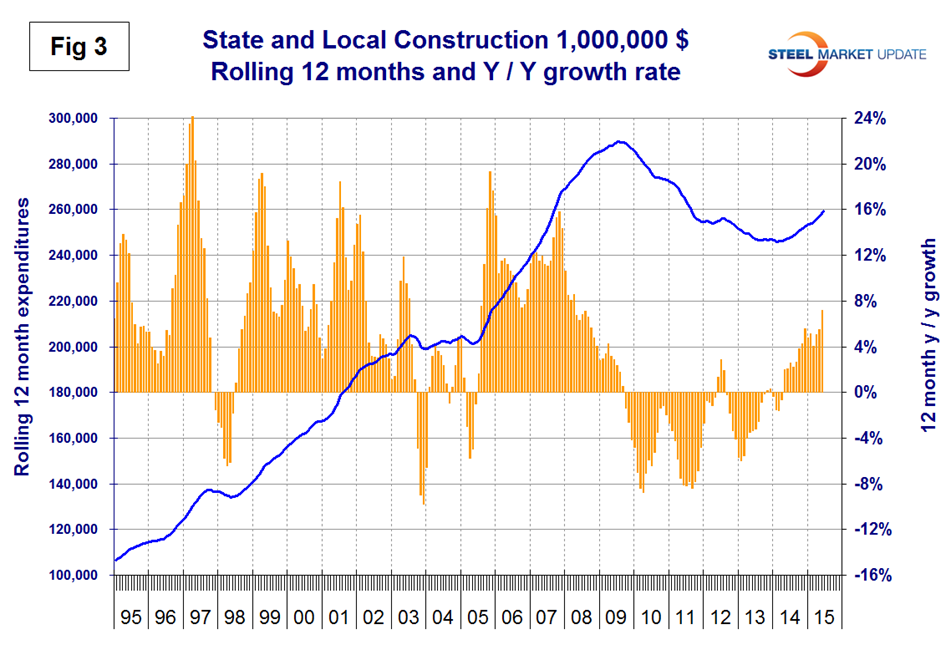
S&L non-residential building grew by 6.9 percent y/y with positive momentum. It looks as though state and local governments are beginning to loosen the purse strings as far as construction is concerned. Educational buildings are by far the largest sub sector of S&L non-residential at $6.417 billion in June. Recreational buildings have accelerated markedly in the last six months and grew by 20.8 percent in the latest data. This includes convention centers, sports arenas, theaters and miscellaneous amusements. Public safety buildings which includes jails, police, courthouses and fire stations have had negative growth for 31 straight months. Comparing Figures two and three it can be seen that S&L construction did not have as severe a decline as private work during the recession and that private work is bouncing back faster. Many state and local governments are still far from healthy but a long period of recovery is underway that will take to the end of the decade to reach pre-recession levels.
Drilling down into the private and S&L sectors as presented in Tables 2 and 3 shows which project types should be targeted for steel sales and which should be avoided. There are some project types within S&L that are doing quite well but there are also major regional differences to be considered.
Infrastructure: Expenditures have had positive growth in each of the last 23 months through June with a +9.1 percent result in the latest data and with positive momentum. This was the best growth rate for infrastructure since December 2007. Highway and streets including pavement and bridges accounts for about 2/3 of total infrastructure expenditures and had positive growth for 15 months through February, contracted in March and April then grew by 2.7 percent and 8.5 percent in May and June respectively (Table 4).
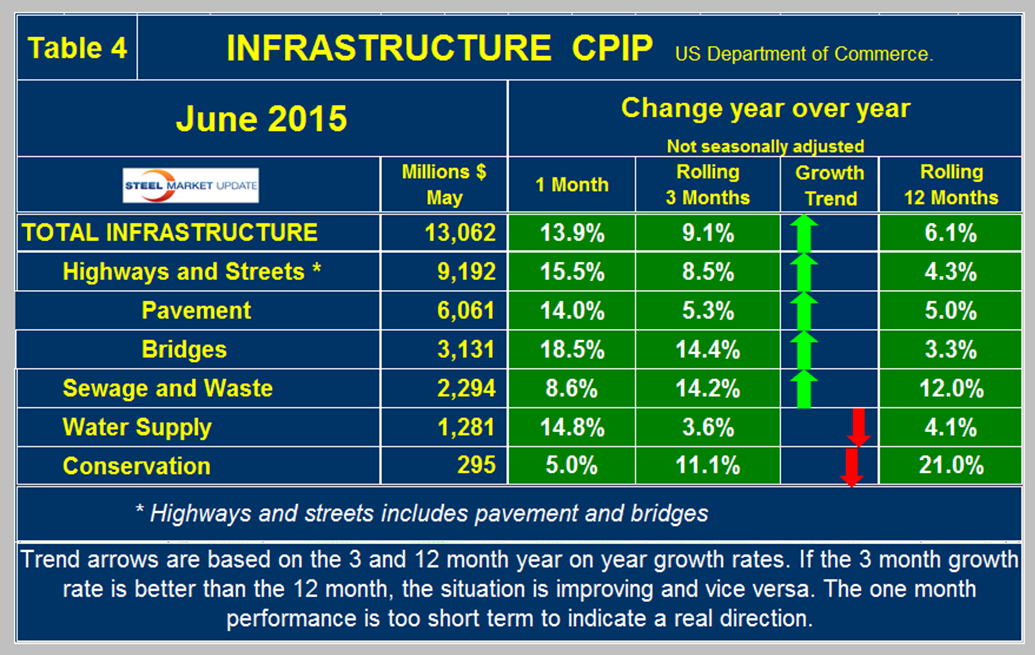
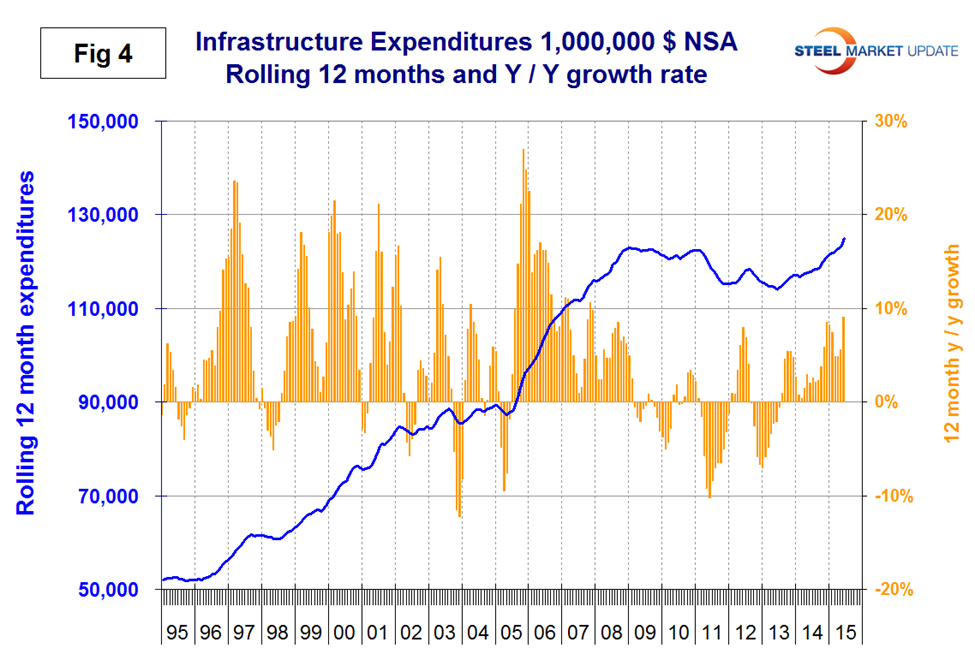
Highway pavement is the main subcomponent of highways and streets and had a 5.3 percent positive growth in three months through June following negative 5.0 percent in March, negative 2.2 percent in April and negative 2.0 in May. Bridge work contracted every month in Q4 2014 but has since expanded every month this year (Not a seasonal effect as we are considering year/year data). Bridge work totaled $3.1 billion in the single month of June with a strong 14.4 percent growth rate. Uncertainty about the future of federal funding is likely to last into at least October this year and this uncertainty results in state governments postponing major projects. That will mean restrained increases in infrastructure starts for both 2015 and 2016. Later this year, hopefully, new legislation will combine with improved state finances and innovative approaches to funding surface transportation projects to lift construction starts more vigorously. Water supply returned to positive growth in June after a slight contraction in May which broke a 10 straight months of expansion. Based on reports of the critical state of water supply out west this sector is likely to have major growth in the next few years. Conservation expenditures have been surging since November 2013 but the outlays are relatively small. On a rolling 12 month basis, infrastructure expenditures are now higher than they were before the recession (Figure 4).
Negotiations on how to fund future infrastructure projects continue in congress. An indication of the present state of affairs is given in the latest “The Hill Blog” published on July 30th and abridged by SMU as we shake our heads at this example of how not to get things done.
The Senate on Thursday approved an $8 billion extension of federal transportation funding, sending it to President Obama’s desk with just one day to go before the nation’s road and transit spending expires. The bill, which extends infrastructure spending until Oct. 29, passed in a 91-4 vote, pushing the debate into the fall. Obama, who has advocated for long-term extension of highway funding, is expected to sign the patch to prevent an interruption in funding during the busy summer construction season.
The vote Thursday came after the Senate passed its preferred fix, a six-year highway bill negotiated by Senate Majority Leader Mitch McConnell (R-Ky.) and Sen. Barbara Boxer (D-Calif.). House Republicans refused to take up that bill and left town on Wednesday, forcing the Senate to accept the three-month stopgap. Republican leaders in the Senate sought to downplay the squabbling between the chambers as they punted the highway debate to the fall.
“We all want the House to have the space to develop its own bill, because we all want to work “McConnell said ahead of the vote.” This is more than just another accomplishment for the Senate. It’s a win for our country because the bill would cut red tape and streamline regulation. It would modernize infrastructure and advance research and innovation,” McConnell said.
The fight over road funding has cut across both parties, with Senate and House Republicans pitted against one another when it comes to the idea – pushed strongly by Rep. Paul Ryan (R-Wis.) – of trying to negotiate a highway bill paid for by tax reform.
Congress is grappling with a funding shortfall for transportation that is estimated to be around $16 billion per year. Since 2005, lawmakers have not passed a transportation bill that lasted longer than two years.
Total Building Construction Including Residential: Figure 5 compares YTD expenditures for building construction for 2014 and 2015.
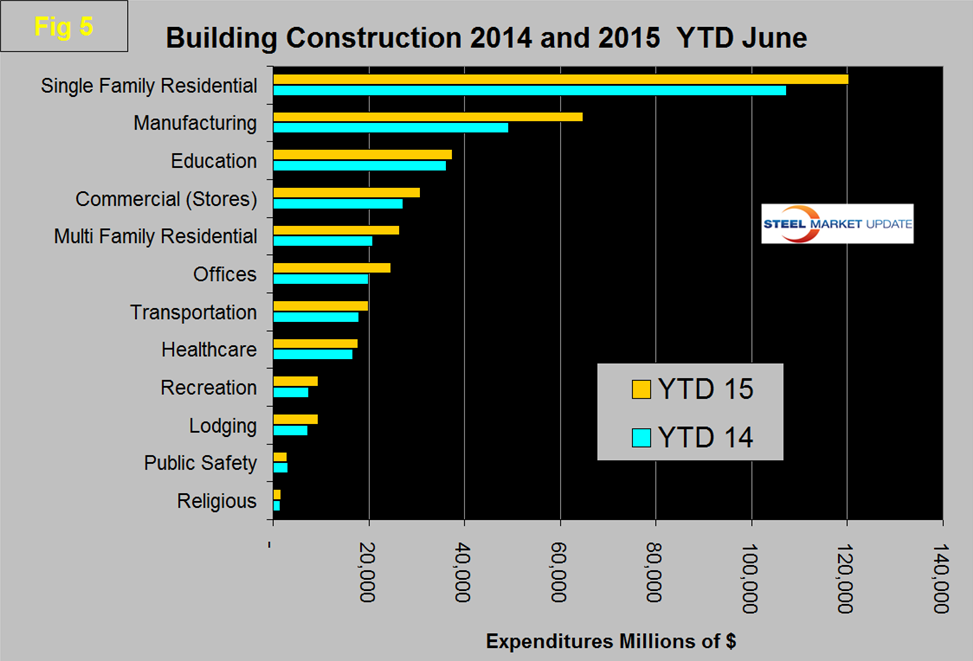
Single family residential is dominant and through June 2015 totaled over $98 billion. On this year over year basis the only sector to be trailing 2014 is public safety which is down by 7.4 percent, at the other extreme manufacturing is up by 31.7 percent.


