

Market Data

August 12, 2015
Net Job Creation through July 2015
Written by Peter Wright
The Bureau of Labor Statistics (BLS) analysis of non-farm employment reported on Friday that 215,000 jobs were added in July which was slightly less than consensus expectations. May and June were revised up by a total of 14,000. Monthly job gains have averaged 246,500 over the past seven months. In the 12 months through July, employment growth averaged 242,900 per month. The three month moving average (3MMA) of gains through July was 235,000 which was up by 9,000 from June (Figure 1).
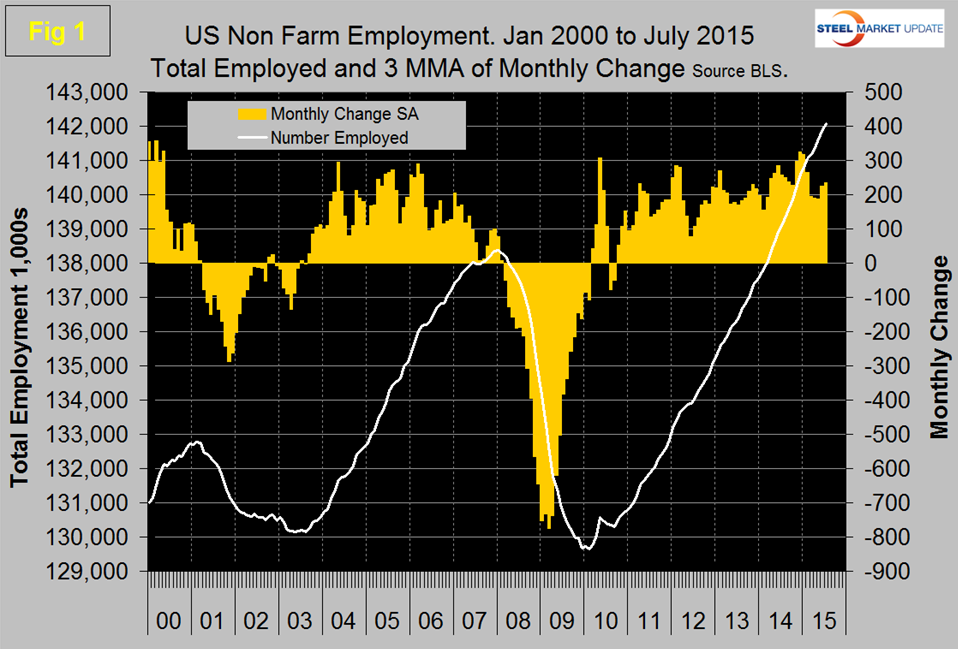
Total nonfarm payrolls are now 3,706,000 more than they were at the pre-recession high of January 2008. All numbers in this analysis are seasonally adjusted by the BLS. The average work week for all employees on private nonfarm payrolls edged up by 0.1 hour to 34.6 hours in July. The manufacturing workweek for all employees also edged up by 0.1 hour to 40.7 hours, and factory overtime was unchanged at 3.4 hours. In July, average hourly earnings for all employees on private nonfarm payrolls rose by 5 cents to $24.99. Over the year, average hourly earnings have risen by 2.1 percent. Average hourly earnings of private-sector production and non-supervisory employees increased by 3 cents to $21.01 in July.
Table 1 slices total employment into service and goods producing industries and then into private and government employees.
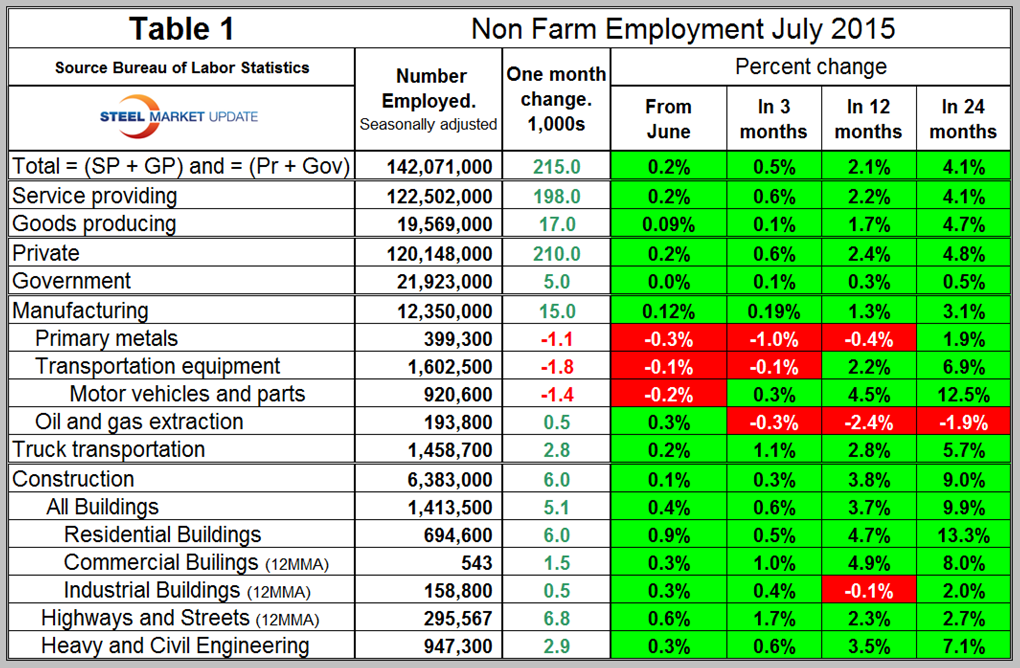
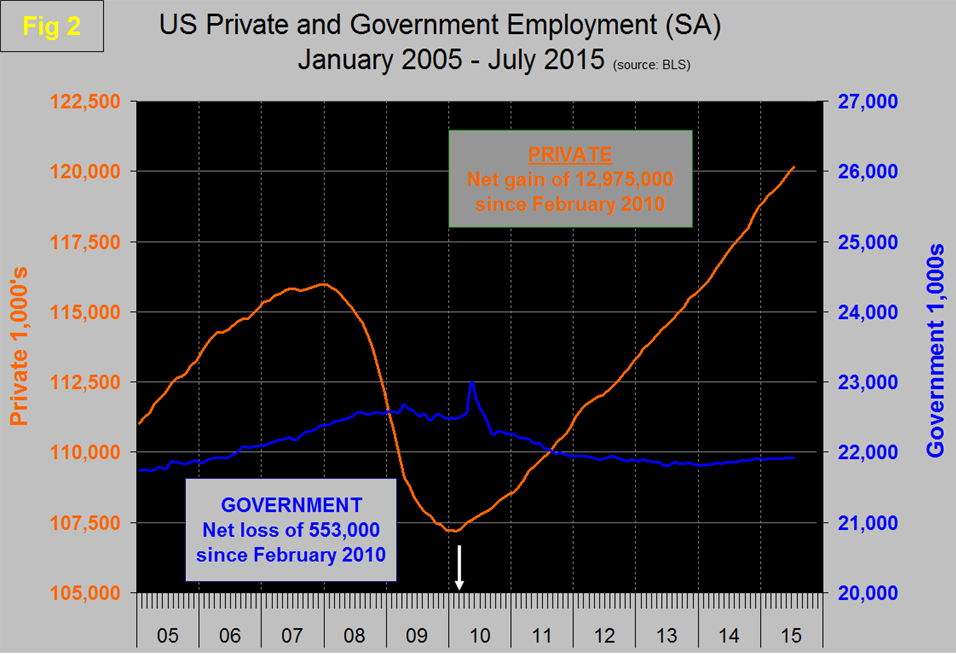
Total employment equals the sum of private and government employees. It also equals the sum of goods producing and service employees. Most of the goods producing employees work in manufacturing and construction and the major components of these two sectors are also shown in Table 1. In July, 210,000 jobs were created in the private sector and 5,000 in government. All the growth in government employment was at the local level with an 8,000 increase, state government employment declined by 3,000 and federal government employment was unchanged. Since February 2010, the employment low point, private employers have added 12,975,000 as government has shed 553,000 (Figure 2).
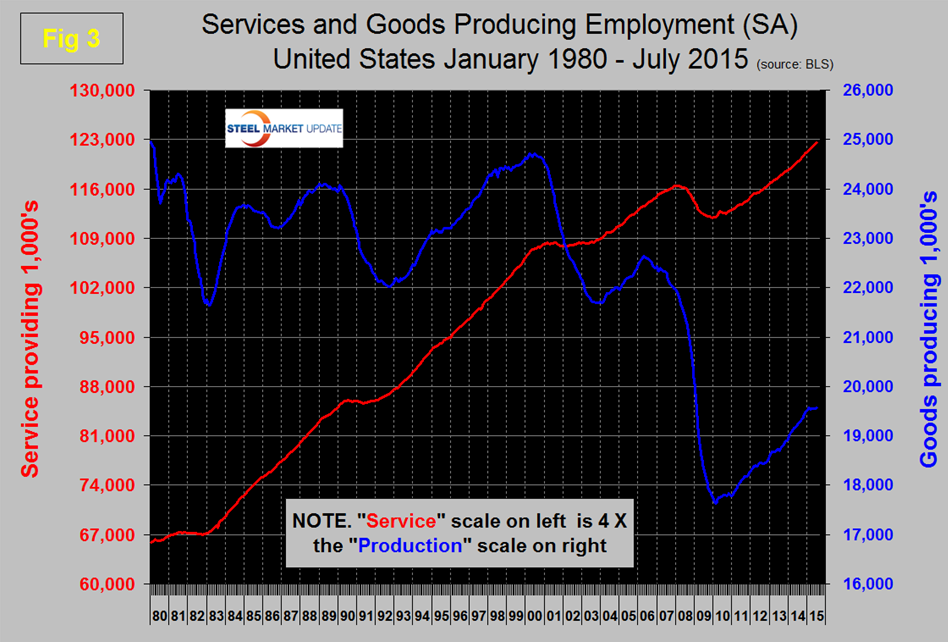
In July service industries expanded by 198,000 and goods producing 17,000 people. Since February 2010, service industries have added 10,480,000 and goods producing 1,942,000 positions (Figure 3).
Returning to Table 1 we see that manufacturing added 15,000 jobs in July which was the best result since January. Note the subcomponents of both manufacturing and construction shown don’t add up to the total because we have only included those that have most relevance to the steel industry. Primary metals has lost 1,100 jobs in July and has had negative growth for the last year. Even transportation equipment and motor vehicles and parts lost jobs in July but oil and gas extraction added a few positions. This doesn’t jive with our other data sources so we will have to wait and see how the situation develops. Truck transportation added 2,800 jobs and is now past the pre-recessionary peak of January 2007. Construction added 6,000 jobs in July, up from zero in June. Some of the major construction sub categories are reported one month in arrears which this month makes that part of table 1 look particularly strange. These include, industrial buildings, commercial buildings and highways and streets. Construction employment in July reached the highest level since February 2009, while the number of unemployed workers with construction experience shrank to a 14-year low, according to an analysis by the Associated General Contractors of America. Association officials cautioned that the diminishing pool of available qualified labor may be having an impact on the industry’s ability to meet growing demand. “It is encouraging to see construction employment rising again, but the industry could hire many more workers if they were available,” said Ken Simonson, the association’s chief economist. “The lack of experienced construction workers may be impeding the industry’s ability to start or complete new projects. The recent acceleration in construction spending may soon level off unless the sector can draw in more workers with the right skills.”
Construction employment totaled 6,383,000 in July and has increased by an average of 6,357 per month in 2015, Simonson noted. “The sector’s job gains in the past five months have been intermittent and relatively sluggish despite signs of accelerating demand for construction,” Simonson said. “The latest Census Bureau data show the amount of construction spending is rising at the fastest rate since 2006, and there are several indicators—such as the steady increase in hiring of architects and engineers—that suggest demand for construction will remain strong, but contractors may have difficulty finding enough workers to take on all those projects.
Note all these numbers are seasonally adjusted by the BLS. Since the bottom of the employment recession, construction and manufacturing are running neck and neck in job creation. Construction has added 883,000 jobs and manufacturing 897,000 since the recessionary employment low point in February 2010 (Figure 4).
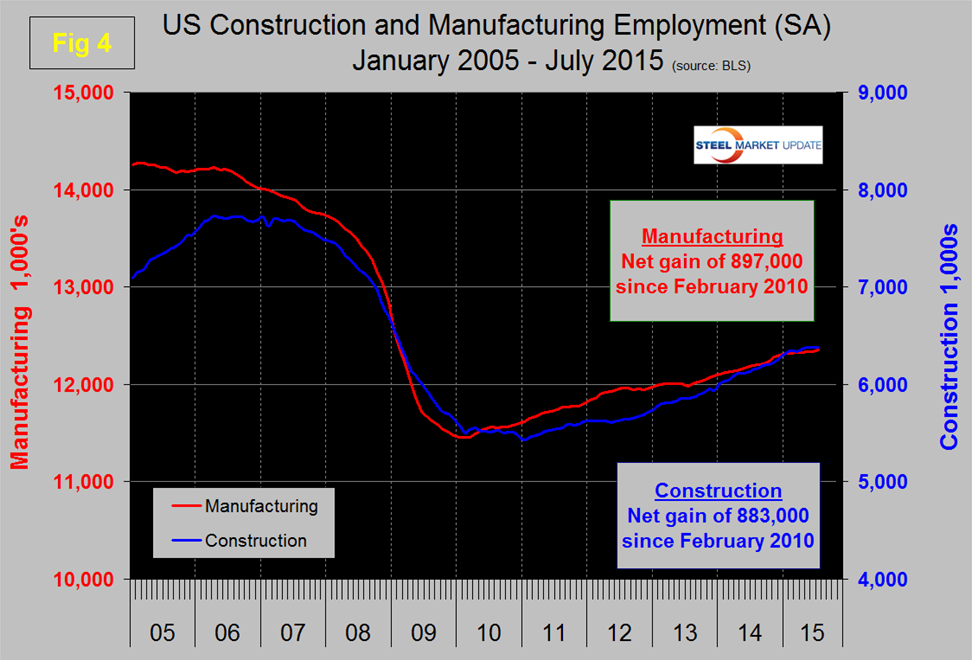
Based on the total construction analysis that we reported last week, we assume that construction jobs will pick up again through the summer. Construction has been holding back steel demand but that should increasingly not be the case.
The official unemployment rate decreased from 5.5 percent in May to 5.3 percent in June and remained unchanged at 5.3 percent in July. This number known as the U3 rate doesn’t take into consideration those who have stopped looking. The more comprehensive U6 unemployment rate decreased from 11.3 percent in January to 10.4 in July (Figure 5).
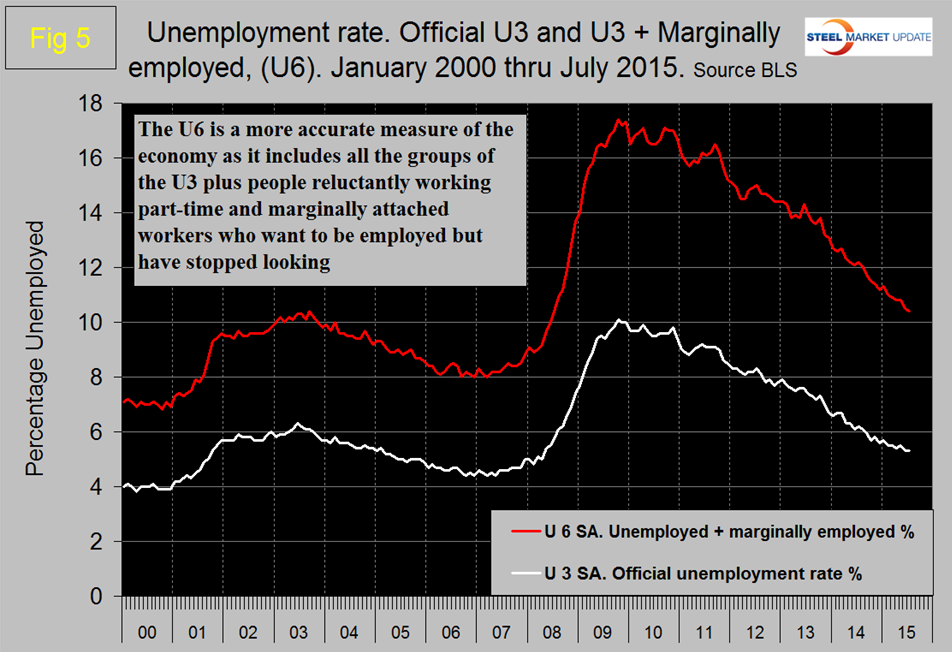
U6 includes workers working part time who desire full time work and people who want to work but are so discouraged that they have stopped looking. The differential between these rates was usually less than 4 percent before the recession but is still 5.1 percent. The good news is that the gap is slowly closing.
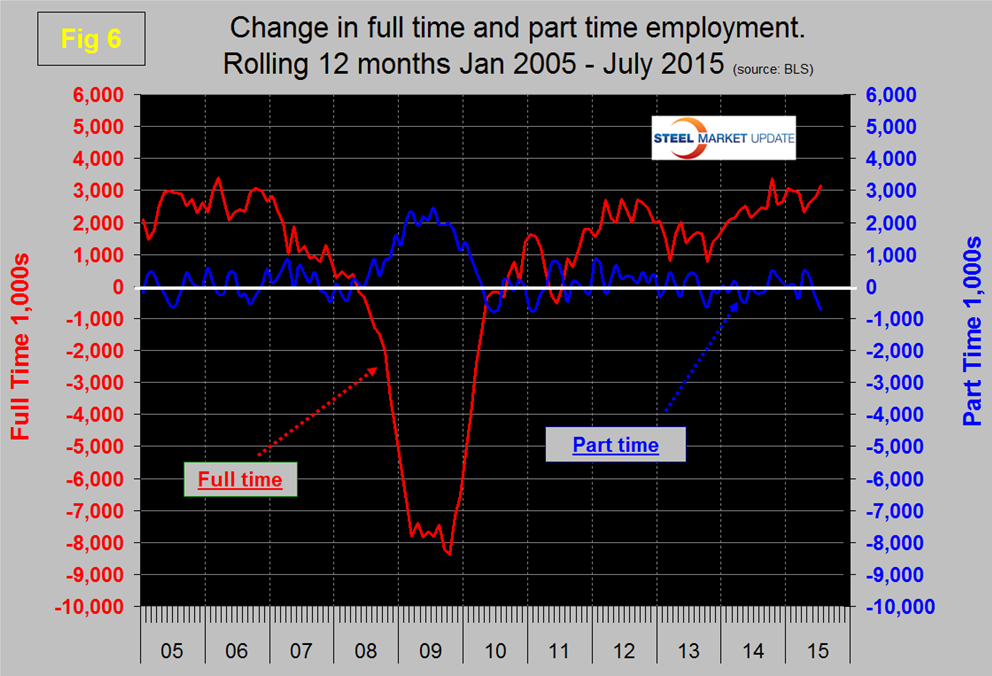
So far in 2015 there has been an increase of 1,655,000 full time jobs and a decrease of 241,000 part time jobs. Figure 6 shows the rolling 12 month total change in both part time and full time employment.
The job openings report known as JOLTS is reported on about the 10th of the month by the Federal Reserve and is over a month in arrears. Figure 7 shows the history of unfilled job openings which have skyrocketed this year to levels not seen since the data series was initiated in 2000.
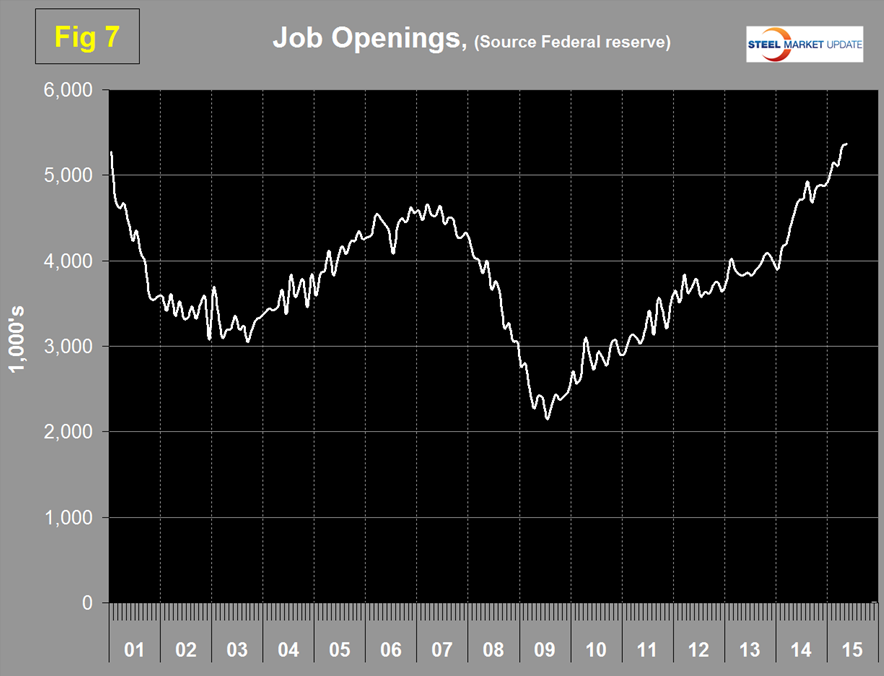
The previous high was 5.25 million at the end of 2000; in 2015 we have seen a surge from 4.965 million in January to 5.363 million in the latest report.
SMU Comment: We are living in what is increasingly a service economy. Service industries including government have added 1,399,000 jobs so far in 2015 compared to only 80,000 in goods producing which is mainly manufacturing and construction. The labor force participation rate stands at 62.7 percent and has been little changed in the last 12 months. The employment report is a useful reality check on our other manufacturing and construction data but needs to be considered on a more extended time base than a single month or even three months. What we are looking for is the long term trends that point to current and future steel demand.


