

Market Data

September 9, 2015
Net Job Creation through August 2015
Written by Peter Wright
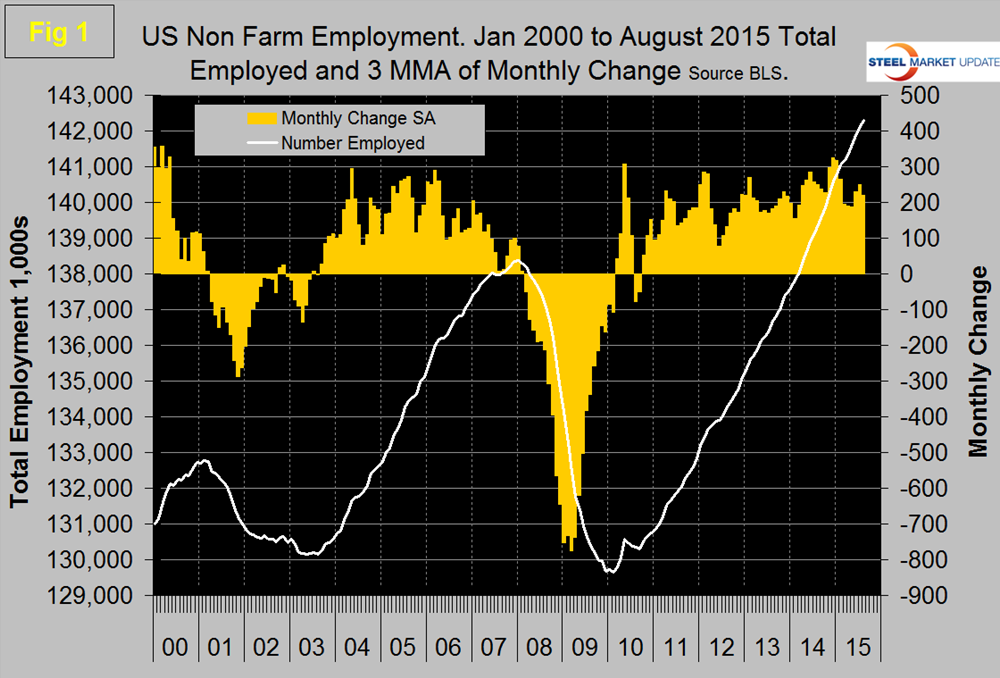
The Bureau of Labor Statistics (BLS) analysis of non-farm employment reported on Friday that 173,000 jobs were added in August which was slightly below Moody’s Analytics expectation. The number will likely be revised upward in subsequent months. June and July payrolls were revised higher by a combined 44,000. The unemployment rate, calculated from a different survey, fell to a new post-recession low of 5.1 percent, as unemployment and the civilian labor force both declined. Monthly job gains have averaged 212,000 per month in the first eight months of 2015. The three month moving average (3MMA) of gains through August was 221,000 which was down by 29,000 from July (Figure 1).
These numbers are seasonally adjusted by the BLS so this month we decided to create a new chart showing what if any seasonality is left in the data after adjustment. Figure 2 suggests that there is still a lot of seasonality in there.
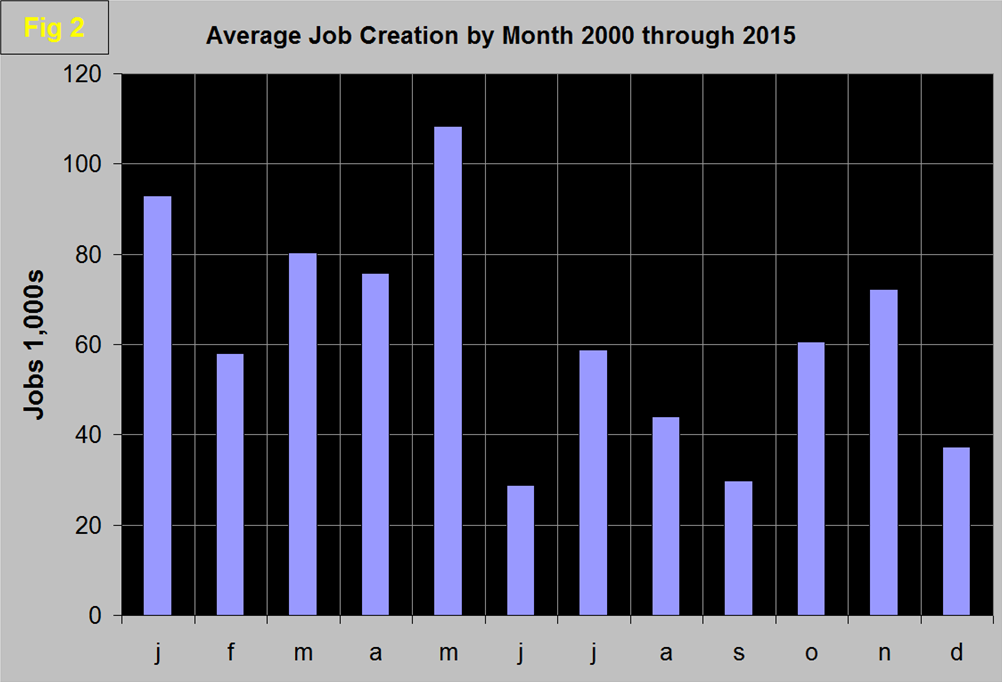
We need to think more about this because of the severe effect of the recession but we do think that the effectiveness of the BLS’s adjustments need to be reviewed. Total nonfarm payrolls are now 3,923,000 more than they were at the pre-recession high of January 2008. The average workweek for all employees on private nonfarm payrolls edged up by 0.1 hour to 34.6 hours in August. The manufacturing workweek was unchanged at 40.8 hours, and factory overtime edged down by 0.1 hour to 3.3 hours. The average workweek for production and non-supervisory employees on private nonfarm payrolls was unchanged at 33.7 hours. In August, average hourly earnings for all employees on private nonfarm payrolls rose by 8 cents to $25.09, following a 6-cent gain in July. Hourly earnings have risen by 2.2 percent over the year. Average hourly earnings of private-sector production and non-supervisory employees increased by 5 cents to $21.07 in August.
Table 1 slices total employment into service and goods producing industries and then into private and government employees.
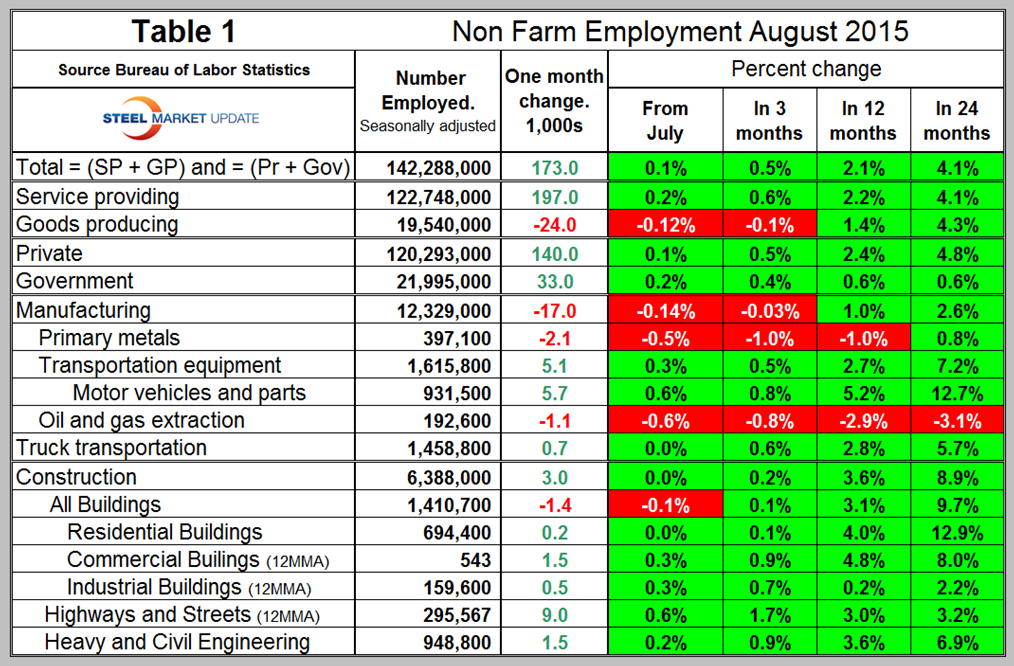
Total employment equals the sum of private and government employees. It also equals the sum of goods producing and service employees. Most of the goods producing employees work in manufacturing and construction and the major components of these two sectors are also shown in Table 1. In August, 140,000 jobs were created in the private sector and 33,000 in government. This was the most jobs created in government in one month since October 2011. Two thirds of government employment expansion in August was at the local level. Since February 2010, the employment low point, private employers have added 13,120,000 as government has shed 481,000. In August service industries expanded by 197,000 as goods producing industries shed 24,000 people. Since February 2010, service industries have added 10,726,000 and goods producing 1,913,000 positions.
Returning to Table 1 we see that manufacturing lost 17,000 jobs in August which was the worst result since July 2013. Note the sub-components of both manufacturing and construction shown don’t add up to the total because we have only included those that have most relevance to the steel industry. Primary metals lost 2,100 jobs in August following 1,100 jobs lost in July and has had not had a positive result in any month of 2015. Motor vehicles and parts gained 5,700 jobs in August, so the poor manufacturing numbers were not due to auto plant summer shutdowns. Oil and gas extraction has had negative job creation in all four time periods examined in Table 1. Truck transportation added 700 jobs and is now past its pre-recessionary peak of January 2007. Construction added 3,000 jobs in August, down from 7,000 in July. Some of the major construction sub categories are routinely reported one month in arrears which distorts the data in Table 1. These include, industrial buildings, commercial buildings and highways and streets. The number of unemployed workers with construction experience dropped to the lowest total for August since 2001, as hiring slowed despite robust demand for construction, according to an analysis by the Associated General Contractors of America. Association officials cautioned that the hiring slowdown likely has more to do with the lack of available workers in many parts of the country than it does low demand. “The recent slowdown in construction hiring appears to reflect difficulty in finding qualified employees rather than lack of projects needing workers,” said Ken Simonson, the association’s chief economist. “The pool of qualified construction workers will need to expand if firms are going to be able to keep pace with rising construction demand.”
Construction employment totaled 6,388,000 in August, the most since February 2009, but the total rose by only 3,000 in August and by an average of only 6,800 per month over the past six months, Simonson noted. In the previous six months, construction employment had risen by an average of 29,700 per month. Meanwhile, the number of unemployed workers who reported last working in construction totaled 525,000, the lowest August amount since 2001. “Hiring has slowed to a crawl in the past six months even though contractors have raised wages at the fastest rate in six years and spending on most types of structures has accelerated,” Simonson said. “Other indicators—such as rising architectural and engineering employment and permits for both single- and multi-family housing—suggest demand for construction will remain strong, but contractors may have difficulty finding enough workers to take on all those projects.”
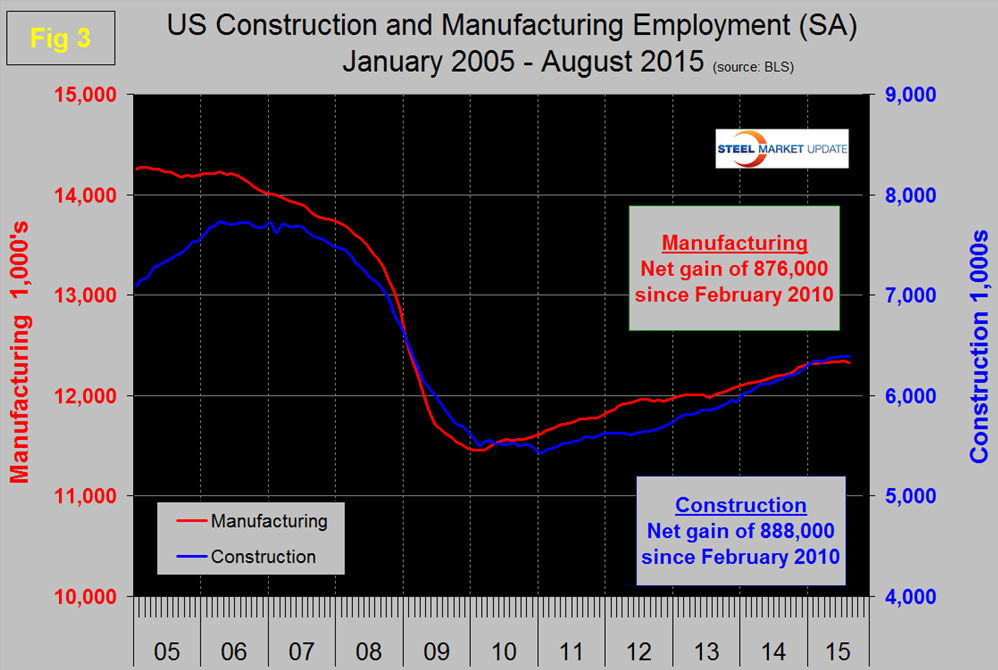
Since the bottom of the employment recession, construction has now crept ahead of manufacturing as a job creator. Having said that, it must be recognized that productivity increases in manufacturing are very much greater than they are in construction. Construction has added 888,000 jobs and manufacturing 876,000 since the recessionary employment low point in February 2010 (Figure 3).
Based on the total construction analysis that we reported last week, we assume that construction jobs will pick up again through the summer assuming labor can be found. Construction has been holding back steel demand but that should increasingly not be the case.
The official unemployment rate decreased from 5.5 percent in May to 5.3 percent in June and July then fell to 5.1 percent in August. This number known as the U3 rate doesn’t take into consideration those who have stopped looking. The more comprehensive U6 unemployment rate decreased from 11.3 percent in January 10.3 in August (Figure 4).
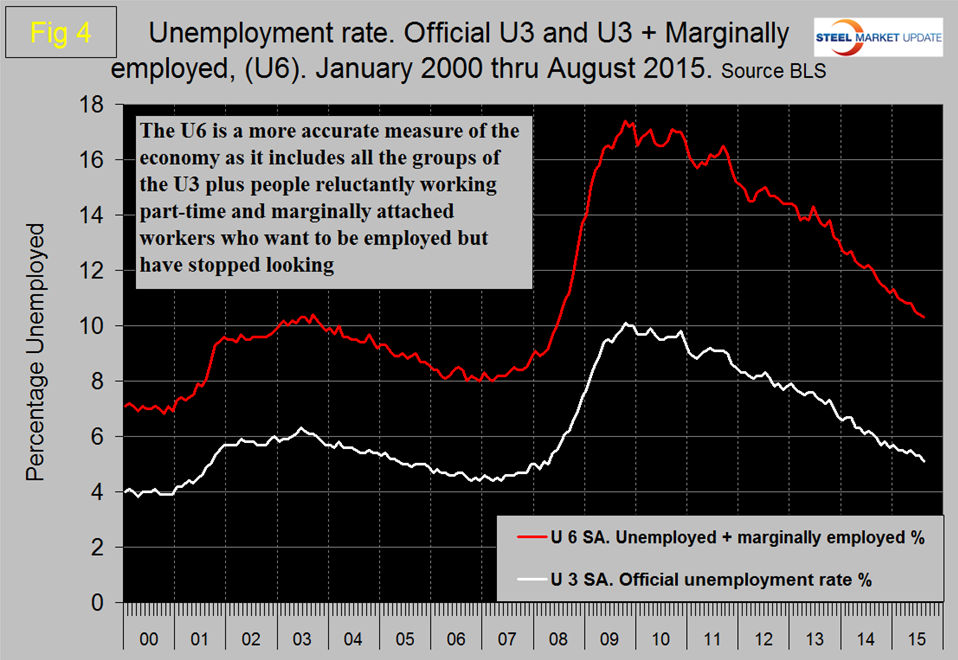
U6 includes workers working part time who desire full time work and people who want to work but are so discouraged that they have stopped looking. The differential between these rates was usually less than 4 percent before the recession but is still 5.2 percent. The good news is that the gap is slowly closing.
So far in 2015 there has been an increase of 2,090,000 full time jobs and a decrease of 589,000 part time jobs. Figure 5 shows the rolling 12 month total change in both part time and full time employment.
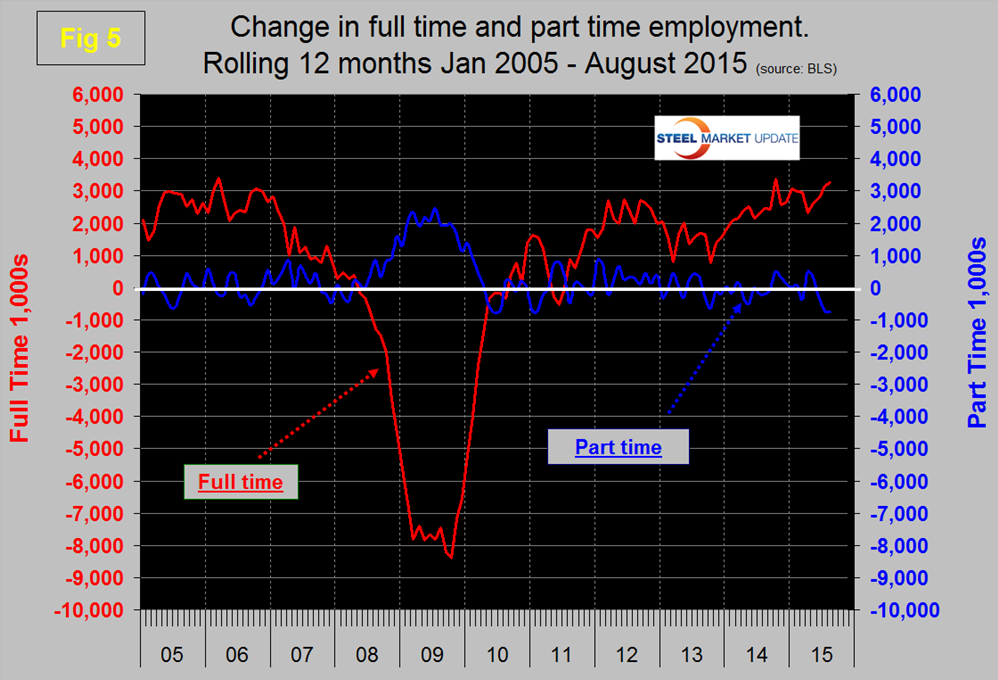
Frequently in the press we read that a large part of job creation is in part time jobs. This is not the case but because the part-time numbers are extremely volatile we have to look at longer time periods than a month or even a quarter to get the picture.
The job openings report known as JOLTS is reported on about the 10th of the month by the Federal Reserve and is over a month in arrears. Figure 6 shows the history of unfilled job openings which have skyrocketed this year to levels not seen since the data series was initiated in 2000.
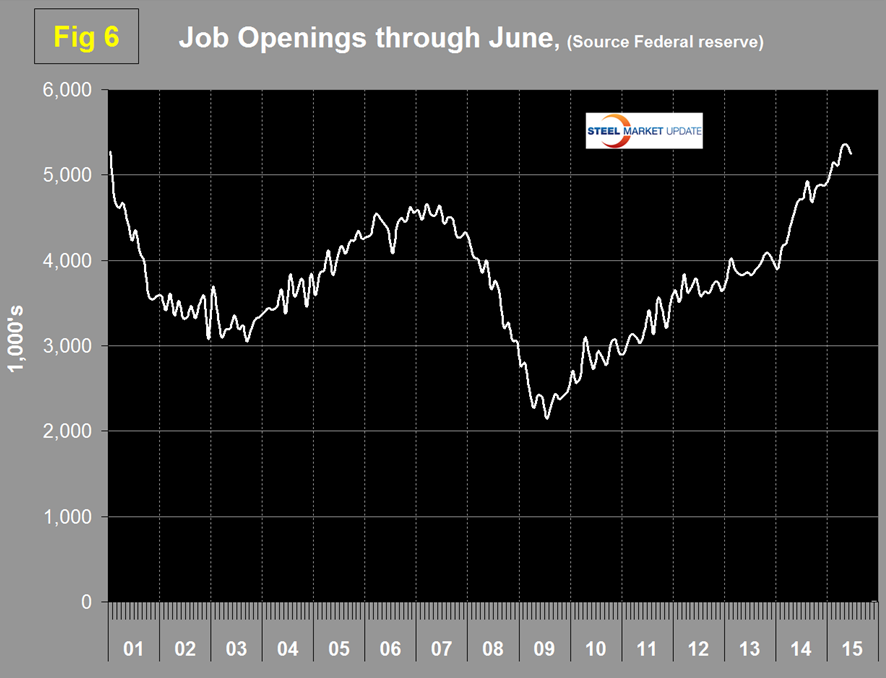
The previous high was 5.25 million at the end of 2000; in 2015 we have seen a surge from 4.965 million in January back to 5.249 million in the latest report.
SMU Comment: We are living in what is increasingly a service economy. Service industries including government have added 1,645,000 jobs so far in 2015 compared to only 51,000 in goods producing which is mainly manufacturing and construction. We enjoyed Dan DiMicco’s presentation at the September SMU Steel Summit in which he repeatedly made the point that for the US to thrive it has to “make stuff”, we can’t get there with the ratio of service to manufacturing jobs that we are experiencing today. Dan has published a book which he signed for conference attendees on Wednesday. The book is titled American Made: Why Making Things Will Return Us to Greatness. All Dan’s proceeds will be donated to Veteran’s support organizations.
The employment report is a useful reality check on our other manufacturing and construction data but needs to be considered on a more extended time base than a single month or even three months. What we are looking for is the long term trends that point to current and future steel demand.


