Analysis

October 9, 2015
Construction Expenditures (CPIP) Through August
Written by Peter Wright
Each month the Commerce Department issues its Construction Put in Place (CPIP) data, usually on the first working day covering activity two months earlier. August data was released on Thursday October 1st.
![]() Construction Put in Place is based on spending work as it occurs, estimated for a given month from a sample of projects. In effect the value of a project is spread out from the project’s start to its completion. Construction starts data published by the Commerce Department for residential construction, by Dodge Data & Analytics and Reed Construction for non-residential and Industrial Information Resources for industrial construction is completely different as in these cases the whole project is entered to the data base when ground is broken. This results in the starts data being extremely spiky which is not the case with CPIP. This month we have a situation where the CPIP data is very good on a year/year basis but the starts data which is month/month is not. Dodge Analytics, who we have great respect for, reported that total construction starts were down by 11 percent from July. “New construction starts in August dropped 11 percent to a seasonally adjusted annual rate of $554.5 billion, according to Dodge Data & Analytics. Declines were reported for each of construction’s three main sectors – nonresidential building and housing pulled back from their improved July pace, while non-building construction continued to recede from the heightened performance witnessed earlier in 2015. During the first eight months of 2015, total construction starts on an unadjusted basis were $446.1 billion, up 15 percent from the same period a year ago. If the volatile electric utility and gas plant category is excluded, total construction starts during the first eight months of 2015 would be up a more moderate 7 percent relative to last year.” In this SMU analysis we don’t normally comment on month over month results but to put the Dodge data into perspective, total construction expenditures according to CPIP was up by 2.5 percent August/July.
Construction Put in Place is based on spending work as it occurs, estimated for a given month from a sample of projects. In effect the value of a project is spread out from the project’s start to its completion. Construction starts data published by the Commerce Department for residential construction, by Dodge Data & Analytics and Reed Construction for non-residential and Industrial Information Resources for industrial construction is completely different as in these cases the whole project is entered to the data base when ground is broken. This results in the starts data being extremely spiky which is not the case with CPIP. This month we have a situation where the CPIP data is very good on a year/year basis but the starts data which is month/month is not. Dodge Analytics, who we have great respect for, reported that total construction starts were down by 11 percent from July. “New construction starts in August dropped 11 percent to a seasonally adjusted annual rate of $554.5 billion, according to Dodge Data & Analytics. Declines were reported for each of construction’s three main sectors – nonresidential building and housing pulled back from their improved July pace, while non-building construction continued to recede from the heightened performance witnessed earlier in 2015. During the first eight months of 2015, total construction starts on an unadjusted basis were $446.1 billion, up 15 percent from the same period a year ago. If the volatile electric utility and gas plant category is excluded, total construction starts during the first eight months of 2015 would be up a more moderate 7 percent relative to last year.” In this SMU analysis we don’t normally comment on month over month results but to put the Dodge data into perspective, total construction expenditures according to CPIP was up by 2.5 percent August/July.
The official CPIP press report gives no appreciation of trends on a historical basis and merely compares the current month with the previous one on a seasonally adjusted basis. The detail is hidden in the published data tables which we at SMU dissect to provide a long term perspective. Our intent is to provide a rout map for those subscribers who are dependent on this industry to “Follow the money.” This is a very broad and complex subject therefore to make this monthly write up more comprehensible we are keeping the information format as consistent as possible. Data is reported by the Commerce Department on both a seasonally adjusted and non-adjusted basis. Their official commentary is based on adjusted numbers. In the SMU analysis we consider only the non-seasonally adjusted data because we don’t trust seasonal adjustments and in any case our businesses operate in a seasonal world. We eliminate seasonal effects by comparing rolling three month expenditures year over year.
In the four tables below we present the non-seasonally adjusted expenditures for the most recent month of data. Growth rates presented are all year over year and are the rate for the single months result, the rolling 3 months and the rolling 12 months. The arrows indicate momentum. If the rolling 3 month growth rate is stronger than the rolling 12 months we define this as positive momentum and vice versa. In the text below when we refer to growth rate we are describing the rolling 3 months year over year rate. In Figures 1 through 4 below the blue lines represent the rolling 12 month expenditures and the brown bars represent the rolling 3 month year over year growth rates.
Total Construction
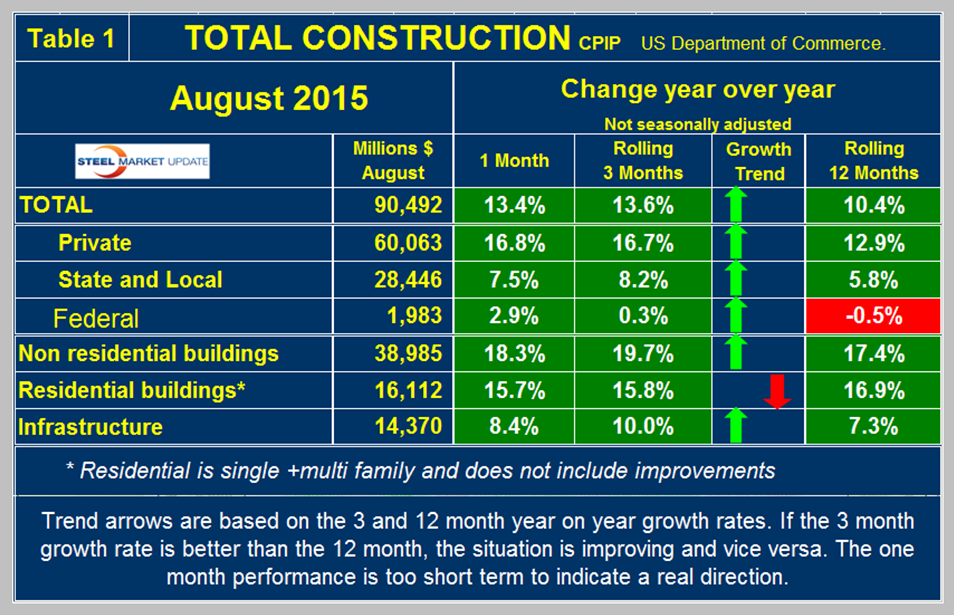
We have reported previously that the June and July CPIP reports were excellent and on a year/year basis we find that August was better. On a rolling three months basis year over year, June was up by 12 percent, July by 13.4 percent and August by 13.6 percent.
August expenditures were $90.5 billion which breaks down to $60.1 B of private work, $28.4 B of state and locally (S&L) funded work and $2.0 B of federally funded (Table 1).
The projected date at which total construction will reach the pre-recession level was Q2 2017 in our May update but the last three months performance could shorten that projection by over a year (Figure 1).
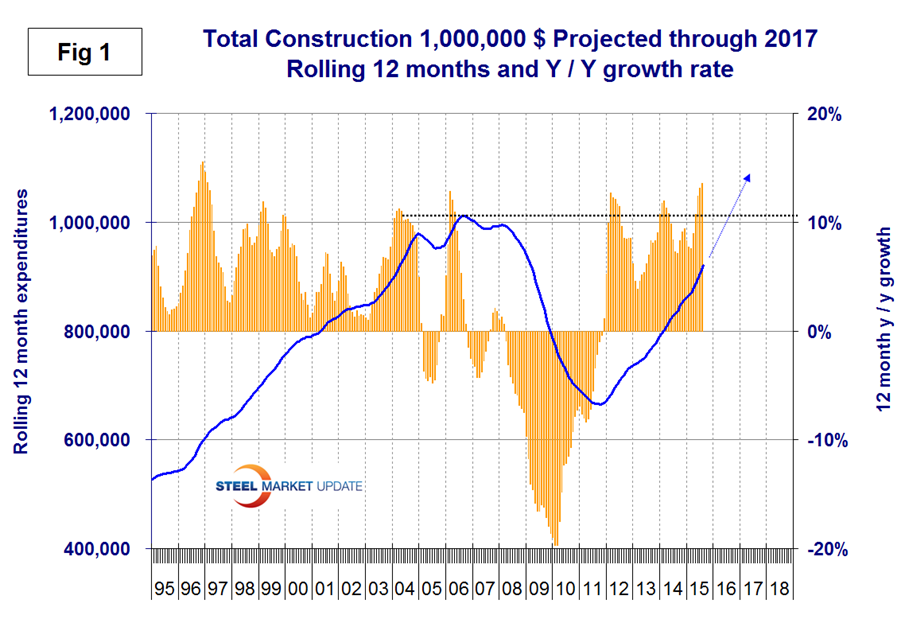
On a rolling three month basis y/y total construction was up by 13.6 percent led by private work up by 16.7 percent. Total construction growth is accelerating since the short term growth (3 months 13.6 percent) is higher than the long term (10.4 percent). We report this as positive momentum. Note this is not a seasonal effect because our y/y analysis removes seasonality. All three categories, private, S&L and federal had positive momentum in the August report. We consider three sectors within total construction. These are non-residential, residential and infrastructure. The growth rate of non-residential buildings is a very high at 19.7 percent and accelerating. Residential is growing at 15.8 percent with negative momentum. Infrastructure grew 10.0 percent in three months through August year over year with positive momentum. The growth rate of total construction slowed in the first three months of this year but improved in the period April through August as shown by the brown bars in Figure 1. The pre-recession peak of total construction on a rolling 12 month basis was $1,145 B in 12 months through February 2007. The low point was $665.1 B in 12 months through October 2011. The 12 month total through the latest data of August 2015 was $920 B. July and August were the first months to exceed $900 B since April 2009.
The number of people employed in construction is another way of measuring current activity. The Associated General Contractors of America track this in detail on a regional basis. We included the following quote from the AGC in our employment update but believe it is also relevant to this discussion. On September 25th the AGC reported as follows: “seasonally adjusted construction employment rose in 36 states and the District of Columbia from August 2014 to August 2015, declined in 13 states and held steady in North Dakota, an AGC analysis of Bureau of Labor Statistics (BLS) data showed. The number of places with year-over-year gains was the smallest since April 2012. California again gained the most construction jobs (43,800 jobs, 6.5 percent), followed by Florida (25,700, 6.4 percent), North Carolina (13,200, 7.4 percent), Washington (12,800, 8.0 percent) and Texas (11,400, 1.7 percent). The highest percentage of new construction jobs were again added by Arkansas (14 percent, 6,200) and Idaho (10 percent, 3,600), followed by South Carolina (9.1 percent, 7,500) and Iowa (8.9 percent, 6,700). The steepest percentage losses again occurred in West Virginia (-15 percent, -5,100) and Rhode Island (-7.9 percent, -1,300), followed by Mississippi (-7.4 percent, -3,600), Ohio (-5.7 percent, -11,300) and New Mexico (-5.2 percent, -2,200). Ohio and West Virginia again had the largest losses, followed by Mississippi, Indiana (-3,600, -2.9 percent) and Louisiana (-3,500, -2.4 percent). For the month, there were gains in 25 states, losses in 24 and D.C., and no change in Louisiana. (BLS combines mining and logging with construction in D.C. and six states to avoid disclosing data about industries with few employers.)”
Private Construction
Table 2 shows the breakdown of total private expenditures into residential and non-residential and subsectors of both.
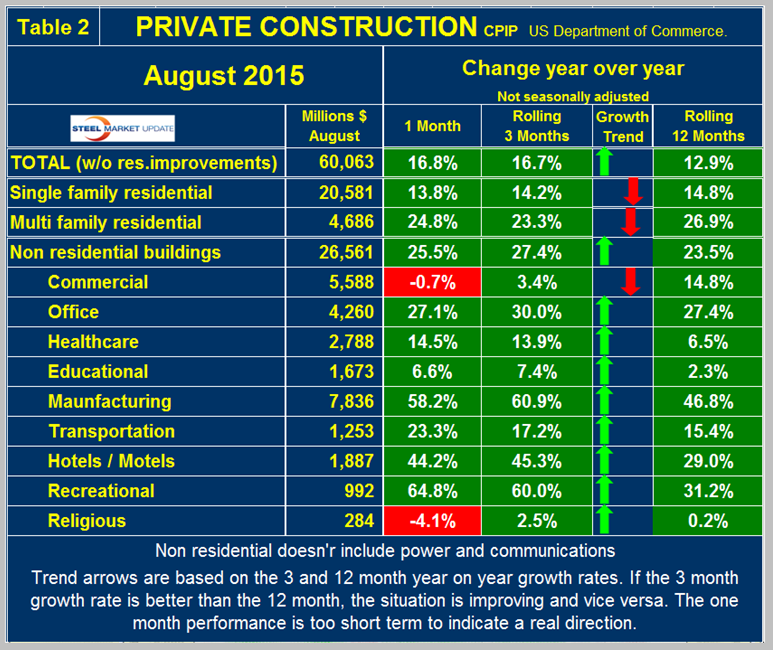
The growth rate of private construction was 16.7 percent in the last three months as shown by the brown bars in Figure 2. The blue lines in all four graphs in this report are 12 month totals which smooths out seasonal variation.
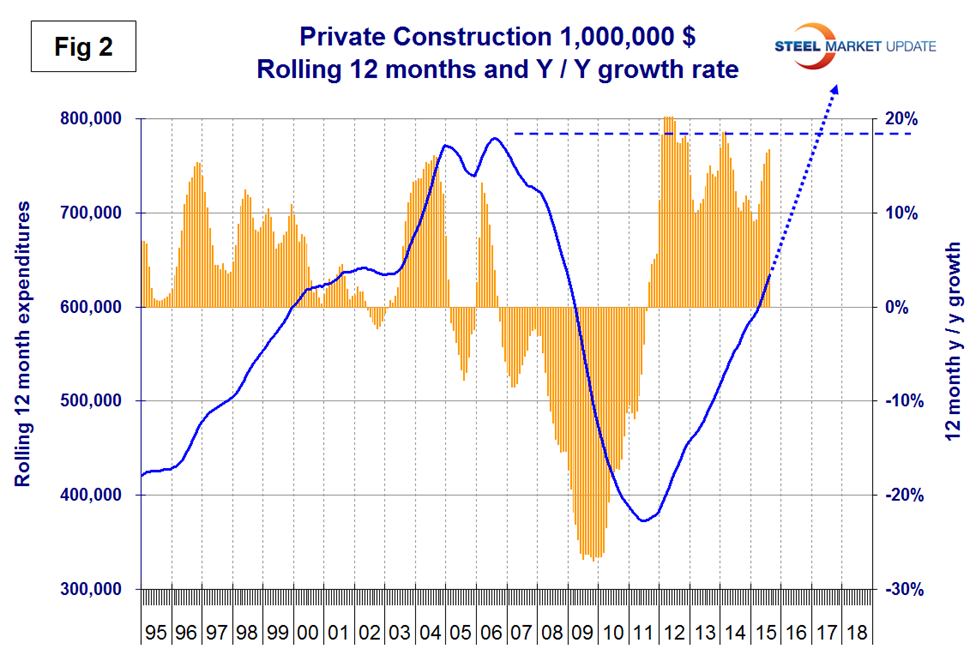
Our analysis of residential construction in this report excludes improvements which are a huge expenditure but which we rationalize as a minimal consumer of steel. Excluding improvements our report shows that both single and multi-family residential continue to have strong y/y growth but both continue to have negative momentum. The single family expenditures reported here have a rate of growth very similar to that of the Census Bureau housing starts data which have a growth rate of 19.0 percent. The growth of starts being similar though better than current expenditures we are discussing here suggests some positive growth going forward. The growth of multifamily expenditures in this CPIP report is higher than construction starts of this sector reported by the Census Bureau. In this CPIP report multi family is growing at 23.3 percent as the multifamily housing starts data from the Census Bureau is growing at 20.1 percent. Note that the housing data published around the 12th of each month reports starts in which the total project cost is entered in the single month of groundbreaking. Private non-residential building expenditures grew at an extraordinary 27.4 percent rate in three months through August y/y with positive momentum. Within private non-residential, all sectors has positive growth led by manufacturing with 60.9 percent and trailed by religious buildings with 2.5 percent. All segments of private nonresidential buildings except commercial (stores) educational and religious had double digit growth in this latest data. About 70 percent of educational buildings are funded by state and local government, total educational buildings (P + S&L) grew at 5.8 percent with positive momentum. Religious buildings had positive growth in April through August for the first time since December 2009.
State and Local Construction
S&L work expanded by 8.2 percent in the rolling three months through August y/y with positive momentum (Table 3).
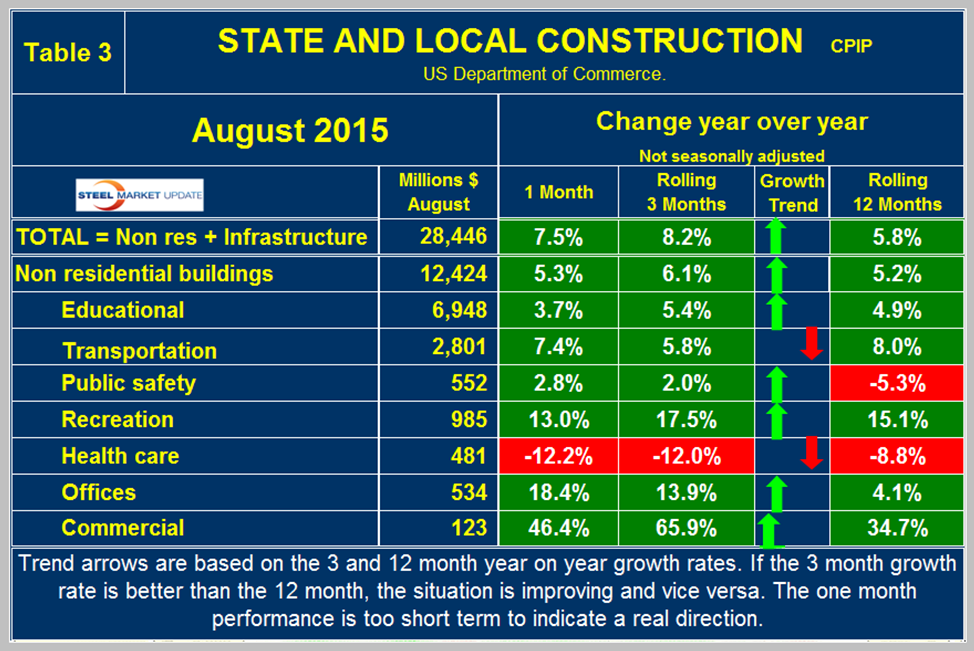
This was the highest rate of growth for S&L since March 2008 and was the eighteenth consecutive month of positive growth, the first time that has happened in four years. Figure 3 shows year over year growth as the brown bars.
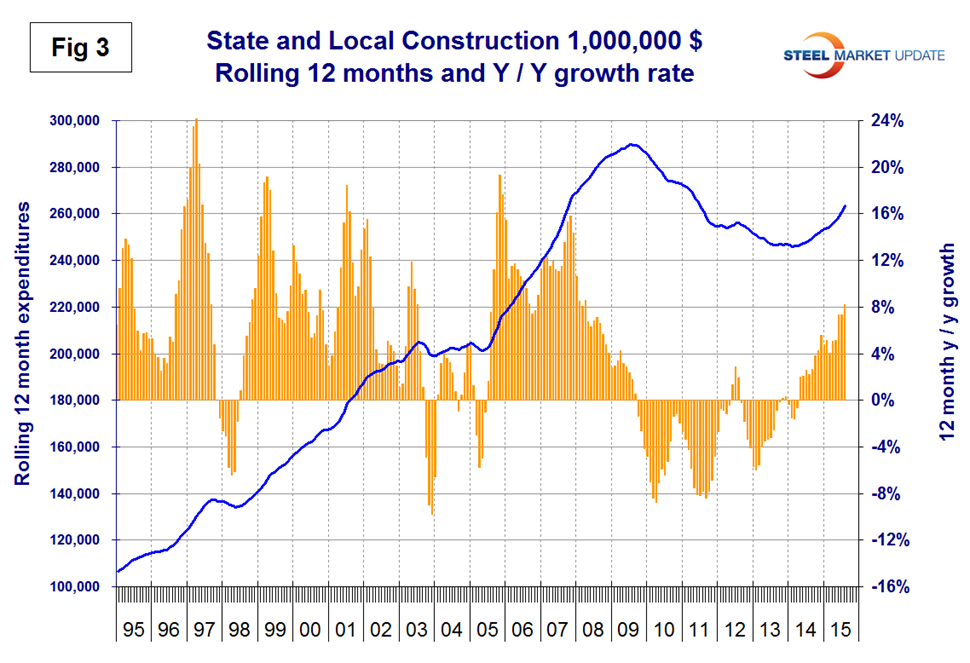
S&L non-residential building grew by 6.1 percent y/y with positive momentum. It looks as though state and local governments are beginning to loosen the purse strings as far as construction is concerned. Educational buildings are by far the largest sub sector of S&L non-residential at $6.948 billion in August. Recreational buildings have accelerated markedly in the first 8 months of 2015 and grew by 17.5 percent in the latest data. This includes convention centers, sports arenas, theatres and miscellaneous amusements. August was the first month for public safety buildings which includes jails, police, courthouses and fire stations to have positive growth after 32 straight months of contraction. Comparing Figures two and three it can be seen that S&L construction did not have as severe a decline as private work during the recession and that private work is bouncing back faster. Many state and local governments are still far from healthy but a long period of recovery is underway that will take to the end of the decade to reach pre-recession levels.
Drilling down into the private and S&L sectors as presented in Tables 2 and 3 shows which project types should be targeted for steel sales and which should be avoided. There are some project types within S&L that are doing quite well but there are also major regional differences to be considered.
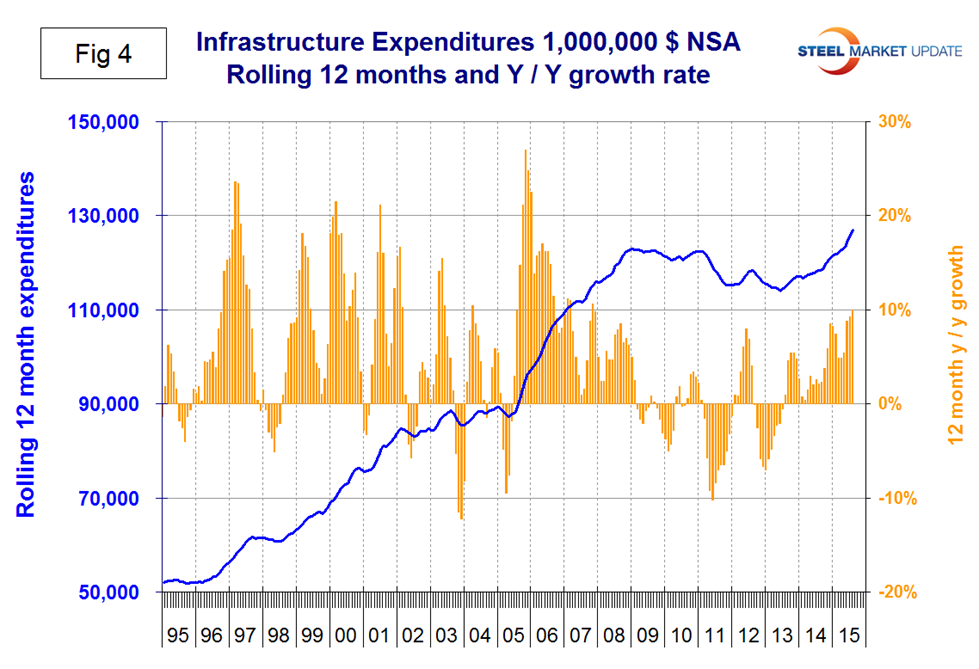
Infrastructure
Expenditures have had positive growth in each of the last 25 months through August with a +10.0 percent result in the latest data and with positive momentum. This was the best growth rate for infrastructure since December 2007. Highway and streets including pavement and bridges accounts for about 2/3 of total infrastructure expenditures and had positive growth for 15 months through February, contracted in March and April then grew by 2.6 percent, 8.4 percent, 9.6 percent and 10.3 percent in May, June, July and August respectively (Table 4).
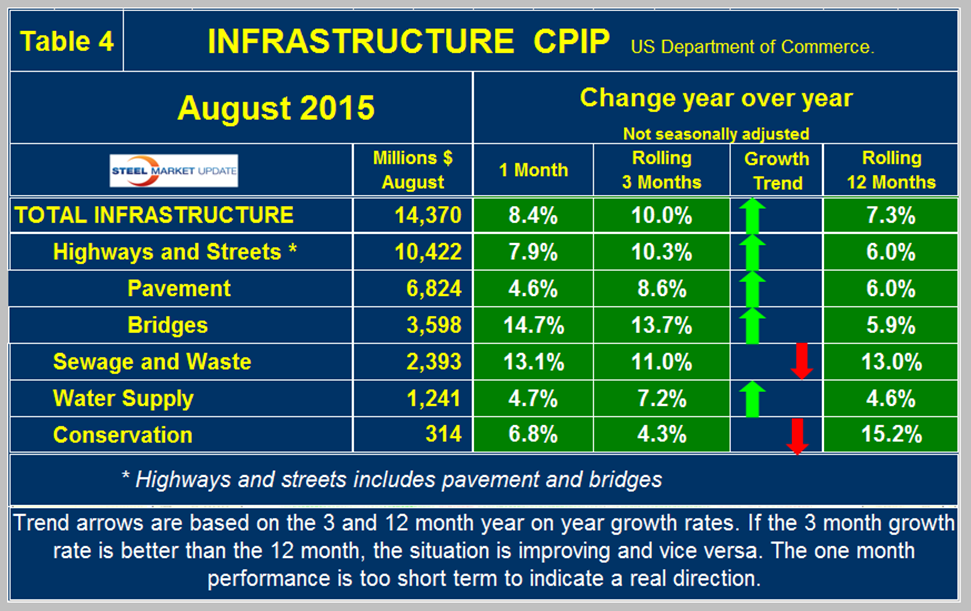
Highway pavement is the main subcomponent of highways and streets and had a 8.6 percent positive growth in three months through August following negative 5.0 percent in March, negative 2.2 percent in April, negative 1.8 in May, positive 5.2 in June and positive 7.2 percent in July. (A nice trend). Bridge work contracted every month in the period August through November 2014 but has since expanded every month with an accelerating trend. Bridge work totaled $3.6 billion in the single month of August with a strong 13.7 percent growth rate. Uncertainty about the future of federal funding is likely to last into at least October this year which results in state governments postponing major projects. That will reduce the growth of infrastructure starts for both 2015 and 2016. Later this year (hopefully), new legislation will combine with improved state finances and innovative approaches to funding surface transportation projects to lift construction starts more vigorously. Water supply returned to positive growth in the three months through August after a slight contraction in May which broke a 10 straight months of expansion. Based on reports of the critical state of water supply out west this sector is likely to have major growth in the next few years. On a rolling 12 month basis, infrastructure expenditures are now higher than they were before the recession (Figure 4).
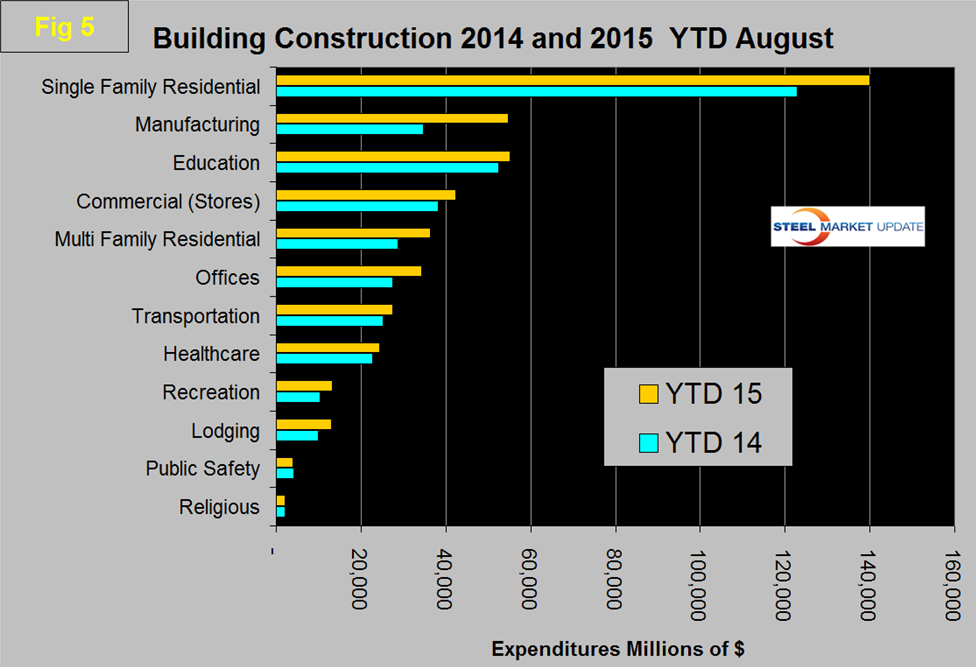
Total Building Construction Including Residential
Figure 5 compares YTD expenditures for building construction for 2014 and 2015. Single family residential is dominant and through August 2015 totaled over $12.7 billion. On this year over year basis the only sector to be trailing 2014 is public safety which is down by 4.6 percent, at the other extreme manufacturing is up by 57.9 percent.