

Market Data

October 9, 2015
Net Job Creation through September 2015
Written by Peter Wright
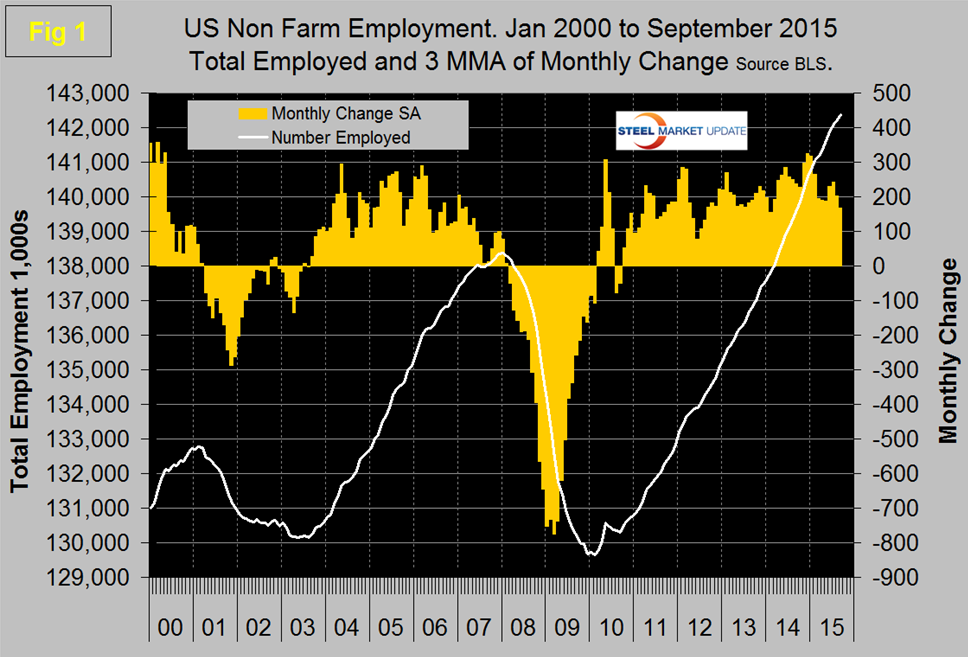
The Bureau of Labor Statistics (BLS) analysis of non-farm employment reported on Friday that 142,000 jobs were added in September which was well below consensus expectations of about 200,000. In addition July was revised down from 245,000 to 223,000 and August was revised down from 173,000 to 136,000. An upward revision for August had been expected.
The average monthly gain for the third quarter was only 167,000. The unemployment rate, calculated from a different survey, was unchanged at 5.1 percent. Monthly job gains have averaged 198,000 per month in the nine months of 2015. The three month moving average (3MMA) of gains through September was 167,000 which was down by 34,000 from August (Figure 1).
These numbers are seasonally adjusted by the BLS so to examine any seasonality is left in the data after adjustment we have developed Figure 2 which suggests that the adjustment is less than perfect.
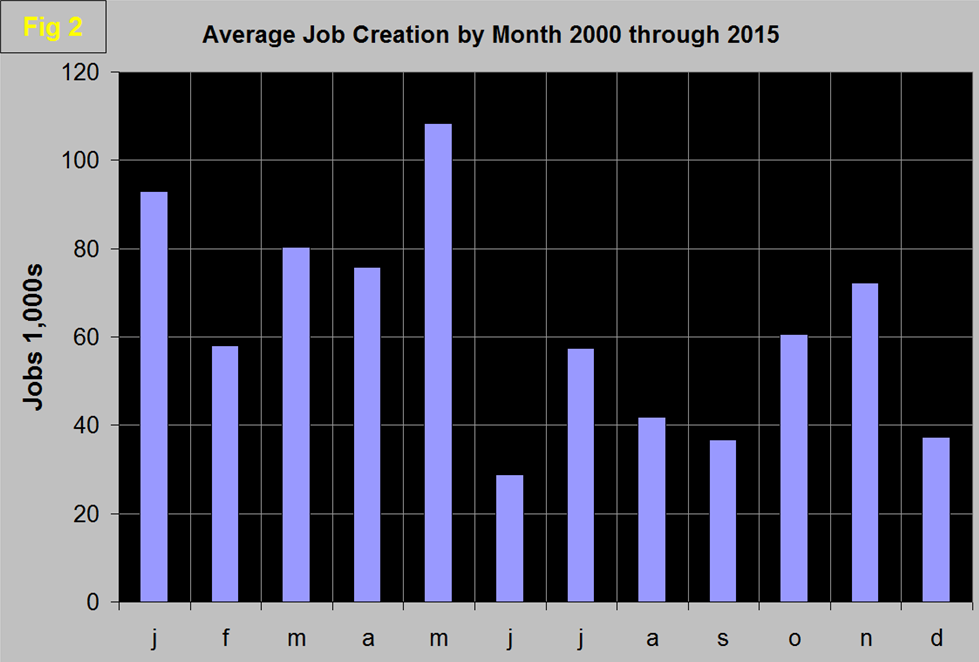
We need to think more about this because of the severe effect of the recession but it does seem that the effectiveness of the BLS’s adjustments need to be reviewed particularly considering the June and December average levels. Total nonfarm payrolls are now 4,006,000 more than they were at the pre-recession high of January 2008. In September, average hourly earnings of all employees on private nonfarm payrolls, at $25.09, were little changed (-1 cent), following a rise of 9 cents in August. Over the past 12 months, average hourly earnings have risen by 2.2 percent. From August 2014 to August 2015, the Consumer Price Index for all Urban Consumers (CPI-U) increased by 0.2 percentage point (on a seasonally adjusted basis).
Table 1 slices total employment into service and goods producing industries and then into private and government employees. Total employment equals the sum of private and government employees. It also equals the sum of goods producing and service employees.
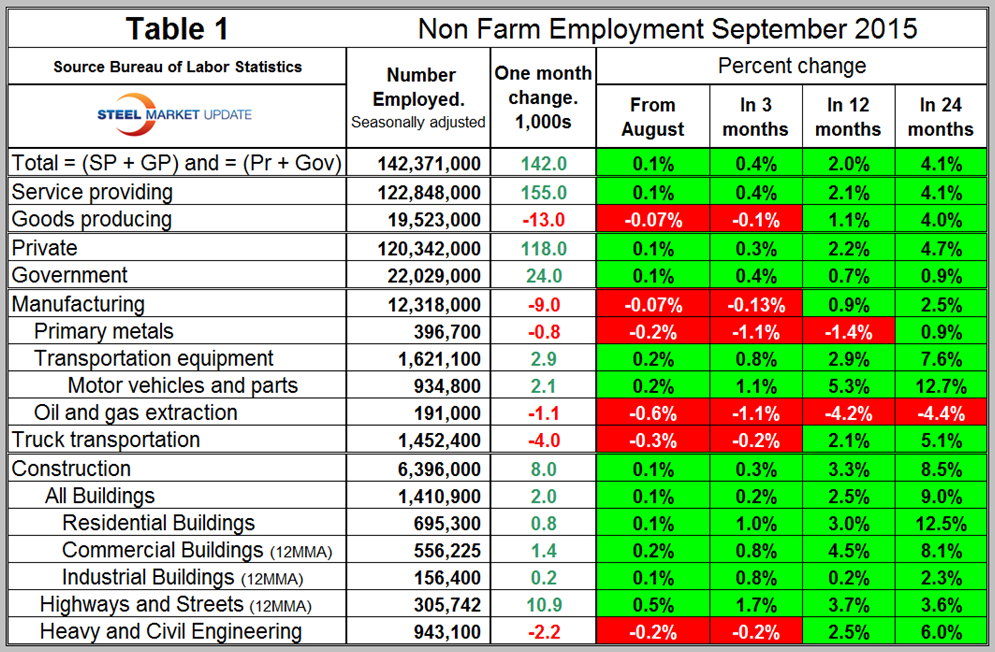
Most of the goods producing employees work in manufacturing and construction and the major components of these two sectors are also shown in Table 1. In September, 118,000 jobs were created in the private sector and 24,000 in government. Most of the government growth was at the state level (17,000) with 9,000 created in local government and 2,000 shed by the federal government. Since February 2010, the employment low point, private employers have added 13,169,000 as government has shed 447,000. In September service industries expanded by 155,000 as goods producing industries shed 13,000 people. Since February 2010, service industries have added 10,826,000 and goods producing 1,896,000 positions.
Returning to Table 1 we see that manufacturing lost 9,000 jobs in September. In all of 2015, manufacturing has gained only 17,000 jobs, another indication along with the ISM Manufacturing Index and the Federal Reserve Industrial Production Index that this sector is slowing. Note the subcomponents of both manufacturing and construction shown don’t add up to the total because we have only included those that have most relevance to the steel industry. Primary metals lost 800 jobs in September, is down by 1.4 percent in the last 12 months and has not had a single positive growth month in 2015. Motor vehicles and parts gained 2,100 jobs in September, oil and gas extraction has had negative job creation in all four time periods examined in Table 1. Truck transportation has deteriorated every month since May culminating in 4,000 jobs lost in September. Construction added 8,000 jobs in September which was the best result since May. Some of the major construction sub categories are routinely reported one month in arrears which distorts the data in Table 1. These include, industrial buildings, commercial buildings and highways and streets. The number of unemployed workers with construction experience dropped to the lowest total for August since 2001, as hiring slowed despite robust demand for construction, according to an analysis by the Associated General Contractors of America. On September 23rd the AGC reported on regional construction employment changes as follows; “seasonally adjusted construction employment rose in 36 states and the District of Columbia from August 2014 to August 2015, declined in 13 states and held steady in North Dakota, an AGC analysis of Bureau of Labor Statistics (BLS) data released today showed. The number of places with year-over-year gains was the smallest since April 2012. California again gained the most construction jobs (43,800 jobs, 6.5 percent), followed by Florida (25,700, 6.4 percent), North Carolina (13,200, 7.4 percent), Washington (12,800, 8.0 percent) and Texas (11,400, 1.7 percent). The highest percentage of new construction jobs were again added by Arkansas (14 percent, 6,200) and Idaho (10 percent, 3,600), followed by South Carolina (9.1 percent, 7,500) and Iowa (8.9 percent, 6,700). The steepest percentage losses again occurred in West Virginia (-15 percent, -5,100) and Rhode Island (-7.9 percent, -1,300), followed by Mississippi (-7.4 percent, -3,600), Ohio (-5.7 percent, -11,300) and New Mexico (-5.2 percent, -2,200). Ohio and West Virginia again had the largest losses, followed by Mississippi, Indiana (-3,600, -2.9 percent) and Louisiana (-3,500, -2.4 percent). For the month, there were gains in 25 states, losses in 24 and D.C., and no change in Louisiana.”
Since the bottom of the employment recession, construction has now crept ahead of manufacturing as a job creator. Having said that, it must be recognized that productivity increases in manufacturing are very much greater than they are in construction. Construction has added 896,000 jobs and manufacturing 865,000 since the recessionary employment low point in February 2010 (Figure 3).
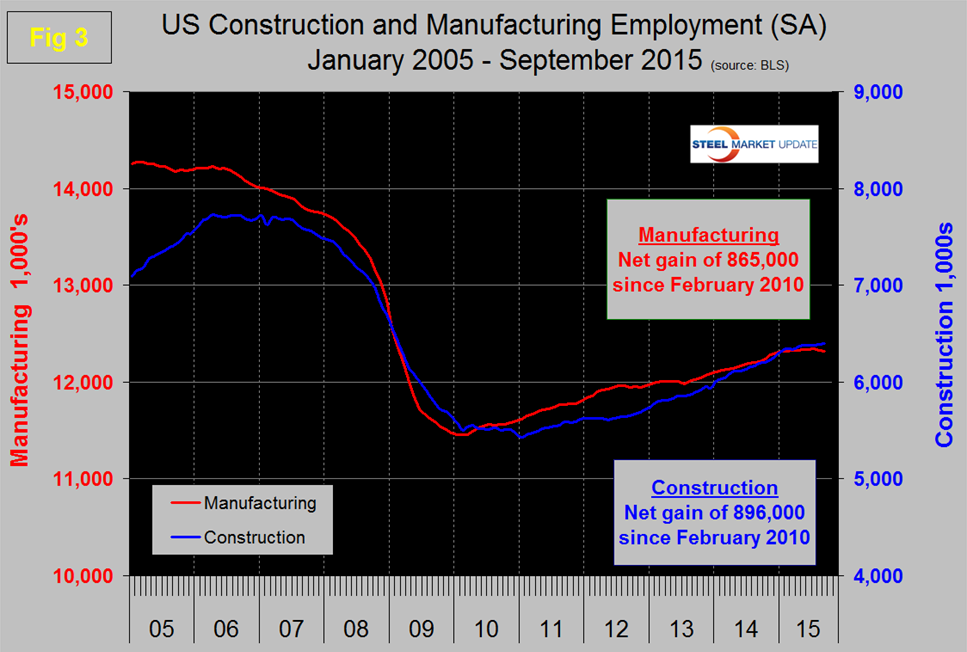
Based on the total construction analysis that we report in our CPIP update, we assume that construction jobs will continue to expand assuming labor can be found. Construction has been holding back steel demand but that should increasingly not be the case.
The official unemployment rate decreased from 5.5 percent in May to 5.3 percent in June and July then fell to 5.1 percent in August and remained at 5.1 percent in September. This number known as the U3 rate doesn’t take into consideration those who have stopped looking. The more comprehensive U6 unemployment rate decreased from 11.3 percent in January to 10.0 percent in September (Figure 4).
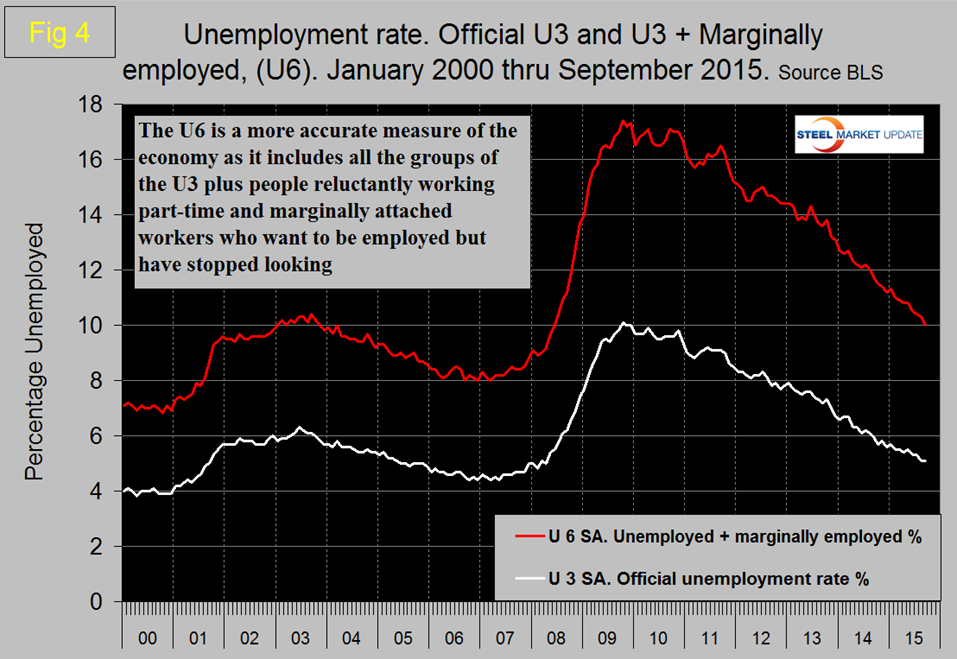
U6 includes workers working part time who desire full time work and people who want to work but are so discouraged that they have stopped looking. The differential between these rates was usually less than 4 percent before the recession but is still 4.9 percent. The good news is that the gap is slowly closing.
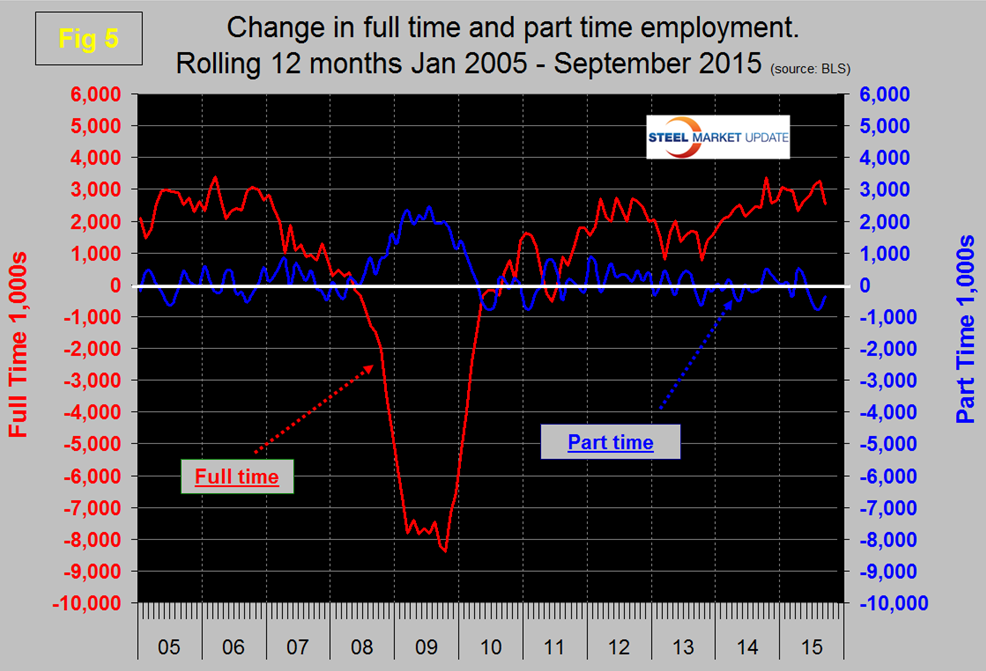
So far in 2015 there has been an increase of 1,905,000 full time jobs and a decrease of 537,000 part time jobs. Figure 5 shows the rolling 12 month total change in both part time and full time employment. Frequently in the press we read that a large part of job creation is in part time employment. This is not the case but because the part-time numbers are extremely volatile we have to look at longer time periods than a month or even a quarter to get the picture.
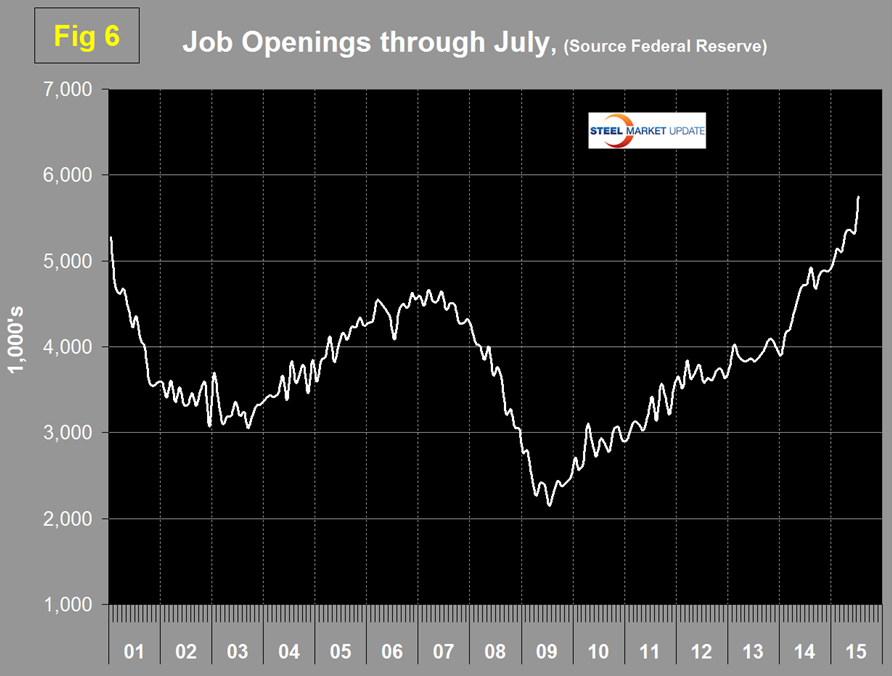
The job openings report known as JOLTS is reported on about the 10th of the month by the Federal Reserve and is over a month in arrears. Figure 6 shows the history of unfilled job openings which have skyrocketed this year to levels not seen since the data series was initiated in 2000. The previous high was 5.25 million at the end of 2000; in 2015 we have seen a surge from 4.965 million in January to 5.753 million in the latest report.
SMU Comment: It’s inescapable that the rate of growth of manufacturing is slowing but this should not be confused with contraction. Construction that has been holding steel consumption back is growing rapidly and with a slowly expanding manufacturing sector, steel demand should improve. The employment report is a useful reality check on our other manufacturing and construction data but needs to be considered on a more extended time base than a single month or even three months. What we are looking for is the long term trends that point to current and future steel demand.


