

Market Data

October 21, 2015
China’s Economic Statistics Q3 2015
Written by Peter Wright
Figure 1 shows published data for the growth of GDP, industrial production and consumer prices through Q3 2015.
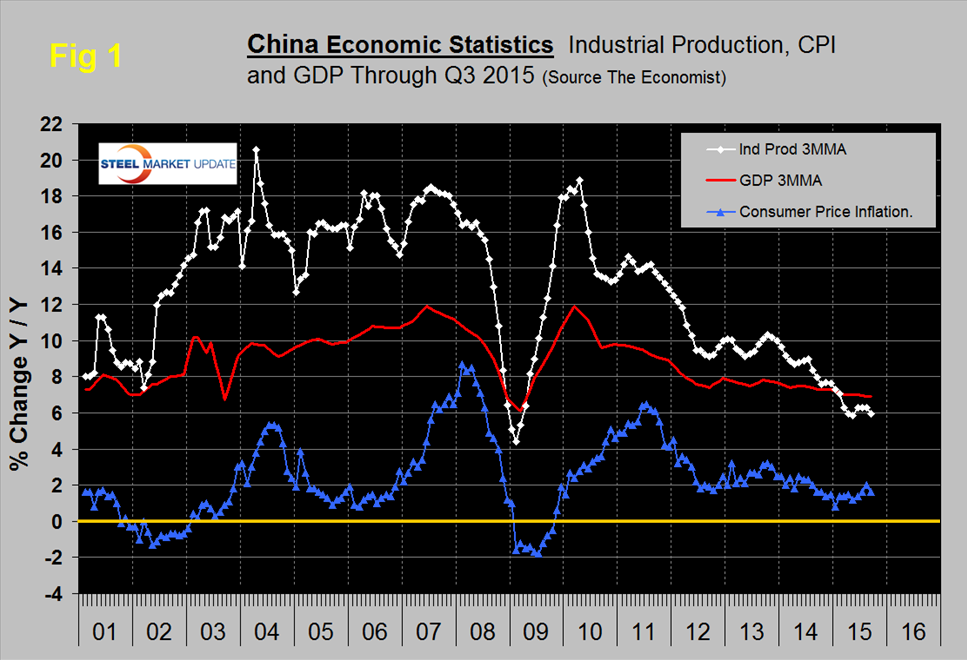
The GDP and industrial production portions of this graph are three month moving averages. The growth of GDP was 6.9 percent in the third Q, beating forecasts for 6.8 percent growth, but decelerating to its slowest pace since the global financial crisis. The results add to doubts that China can meet its year-end GDP target of about 7 percent, and raises pressure on Beijing to roll out more stimulus measures following a summer stock market plunge and devaluation of the yuan. According to Economy.com, China’s statistics agency is known for ‘smoothing’ the GDP series, by lowering spikes in output and raising dips, which gives the series an artificial stability. In their opinion China’s GDP is lower than the official number.
The growth of industrial production in September declined to 5.7 percent, its lowest value since the recession and missed the consensus of a 6.0 percent increase. The three month moving average (3MMA) declined to 5.9 percent from 6.1 percent in August. Overcapacity in heavy industry sectors such as steel and coal continued to be the main drag on production. The government’s ongoing program to re-balance the economy in favor of domestic consumption is continuing and this will slow the absorption of the excess steel capacity that has arisen during the last decade.
Consumer price inflation has been oscillating between 1.4 percent and 2.0 percent since January and in September came in at 1.6 percent, down from 2.0 percent in August. Food prices dropped sharply. Nonfood inflation remains low, because of falling energy costs and demand expanding either below or close to supply across most product categories.
Figure 2 shows the growth of fixed asset investment year over year.
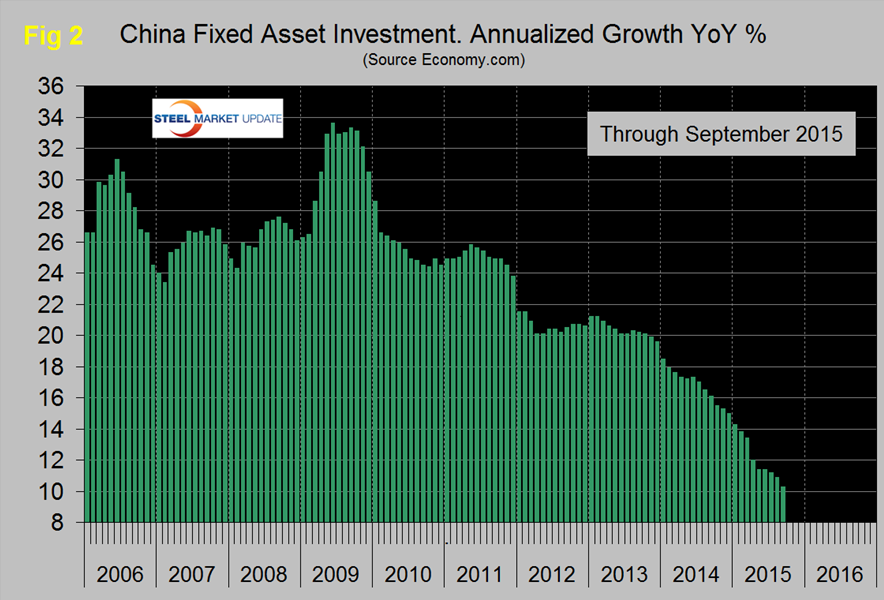
The decline experienced in 2013 accelerated through all of 2014 and through May of 2015. At 10.3 percent in September the decline continued. We understand that this data includes real-estate purchases so is not a direct reflection of constructional steel demand. We are assuming that the steel on the ground portion of this data follows the overall trend and that the contraction in FAI is in accordance with the stated objective to rebalance the economy in favor of consumer consumption. Weaker investment in fixed assets is contributing to slower demand across a number of industries including steel and is pressuring corporate profits. Policymakers have tried to soften the landing through interest rate cuts but there’s little evidence that this is having the desired effect. Further rate cuts could be on the way later this year and next year. In addition the slowdown in the global economy will hurt investment in manufacturing.
SMU Comment: The fears of the global steel industry that Chinese overcapacity would eventually become critical have come to pass. We estimate that global steel overcapacity is now about 460 million tonnes per year and of that a high proportion is in China. In 12 months through September, China produced 805.6 million tonnes and their growth is now negative 1.5 percent on a rolling 12 months basis year over year. China is now pushing more than the total of US steel production onto the world market.


