

Analysis

October 23, 2015
US Vehicle Sales and NAFTA Vehicle Production in September 2015
Written by Peter Wright
In September, vehicle sales reached a new post-recession high of almost 18.2 million units at a seasonally adjusted annual rate. This followed the August rate of 17.8 million units. Both at the time were the best pace since July 2005, when incentives caused sales to surge. Sales in September were 10 percent higher than the same month a year ago. Light trucks continued to dominate with 10.3 million, the balance, 7.9 million being autos. Crossover vehicles are classified as light trucks. The light truck share at 57 percent was the highest in 10 years.
![]() So far this year, the sales pace average is 17.2 million units and it is likely that 2015 will have the best pace since 2001. Pent-up demand for vehicles is being quickly absorbed and the decline in gasoline prices is encouraging consumers to buy larger vehicles. The Ford F series has maintained its #1 spot in spite of reservations about the F150 aluminum body. Year to date Ford F series sales through September were 527,583 units, the Chevy Silverado was 440,904 units and the Dodge Ram was 319,704 units. The only car to make it into the top four was the Toyota Camry with 326,330 units. North American assembled vehicles had a market share of >80 percent in September.
So far this year, the sales pace average is 17.2 million units and it is likely that 2015 will have the best pace since 2001. Pent-up demand for vehicles is being quickly absorbed and the decline in gasoline prices is encouraging consumers to buy larger vehicles. The Ford F series has maintained its #1 spot in spite of reservations about the F150 aluminum body. Year to date Ford F series sales through September were 527,583 units, the Chevy Silverado was 440,904 units and the Dodge Ram was 319,704 units. The only car to make it into the top four was the Toyota Camry with 326,330 units. North American assembled vehicles had a market share of >80 percent in September.
Total light vehicle (LV) production in NAFTA in September was at an annual rate of 18.251 million units, production in the first nine months of this year has averaged 17.43 million units. In cases where seasonality is more than a weather effect we like to compare the monthly result with the monthly norm over a number of years. On average since 2004, September’s production has been 3.1 percent less than August. This year September was 1.3 percent higher than August (Figure 1).
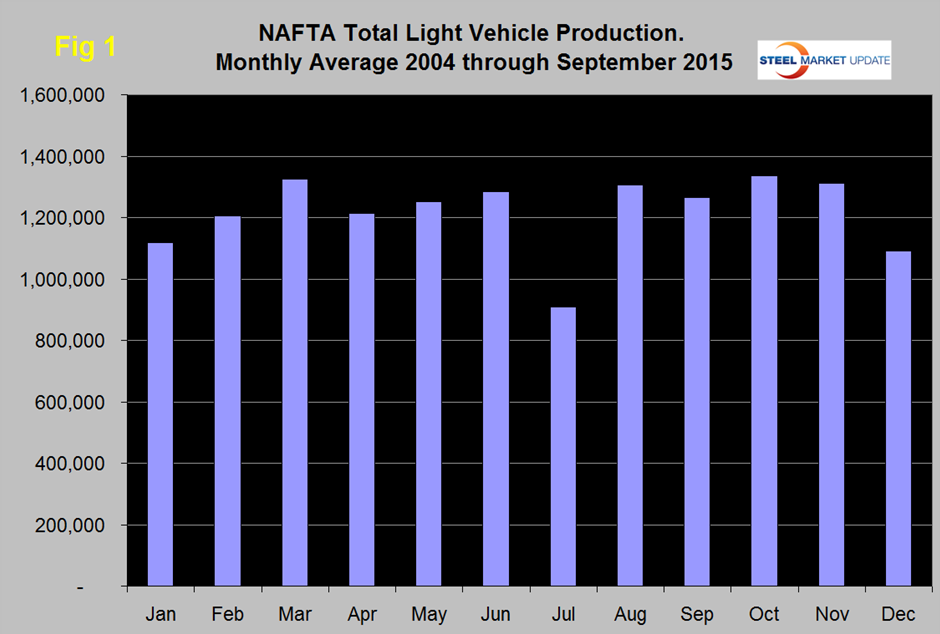
Note that these production numbers are not seasonally adjusted, the sales data reported above are seasonally adjusted.
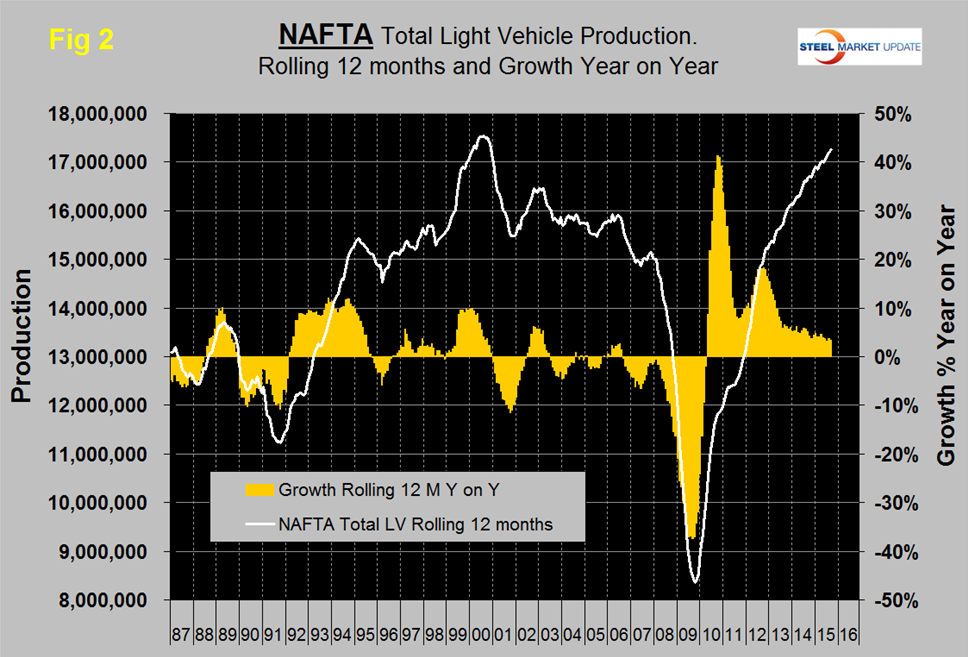
On a rolling 12 months basis y/y through September, LV production in NAFTA increased by 3.4 percent and the growth rate has been slowing since the beginning of 2013. LV production in NAFTA is now well above the pre-recession peak of Q2 2006 and is heading for the all-time high of mid-2000 (Figure 2).
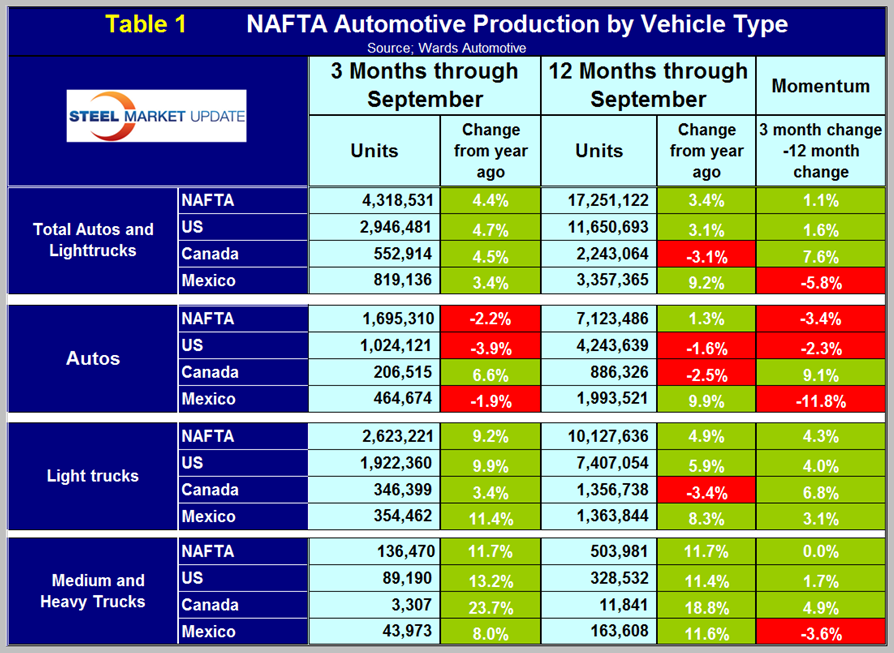
On a rolling 12 months basis y/y the US is up by 3.1 percent, Canada is down by 3.1 percent and Mexico is up by 9.2 percent (Table 1).
Growth rates in 3 months through September y/y indicate that the US and Canada have positive momentum but that of Mexico is negative. Mexico has had negative momentum for five straight months and in six of the last seven months. The US has gained production share in the most recent 3.5 years (Figure 3) and so far in 2015 that gain has accelerated at the expense of Canada. Mexico’s share has been fairly flat.
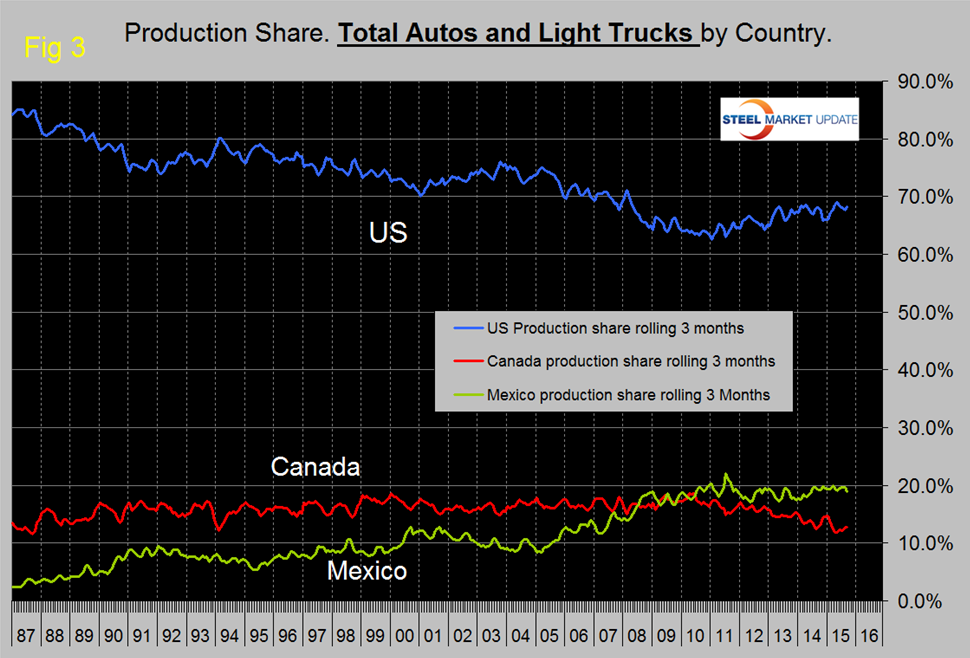
A close examination of Canadian and US share this year in Figure 3 shows that there is a mirror image effect suggesting that the auto companies routinely move production from one side of the border to the other. In September on a rolling three month basis, the US production share of total light vehicles was 68.2 percent, Canada’s was 12.8 percent and Mexico’s was 19.0 percent.
Figure 4, Figure 5 and Figure 6 show total LV production by country with y/y growth rates and on each the red line shows the change in production since Q2 2006.
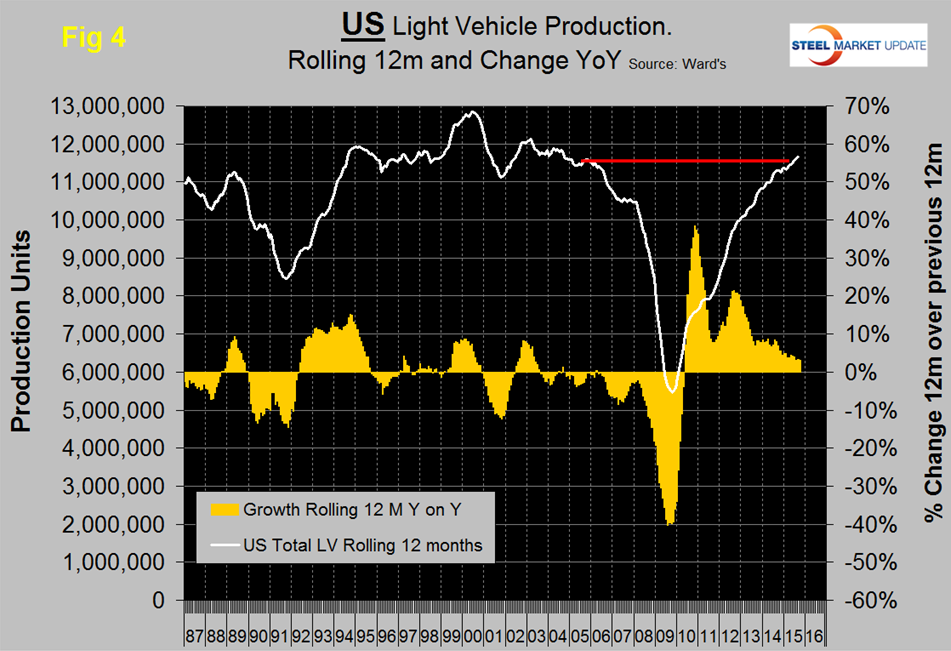
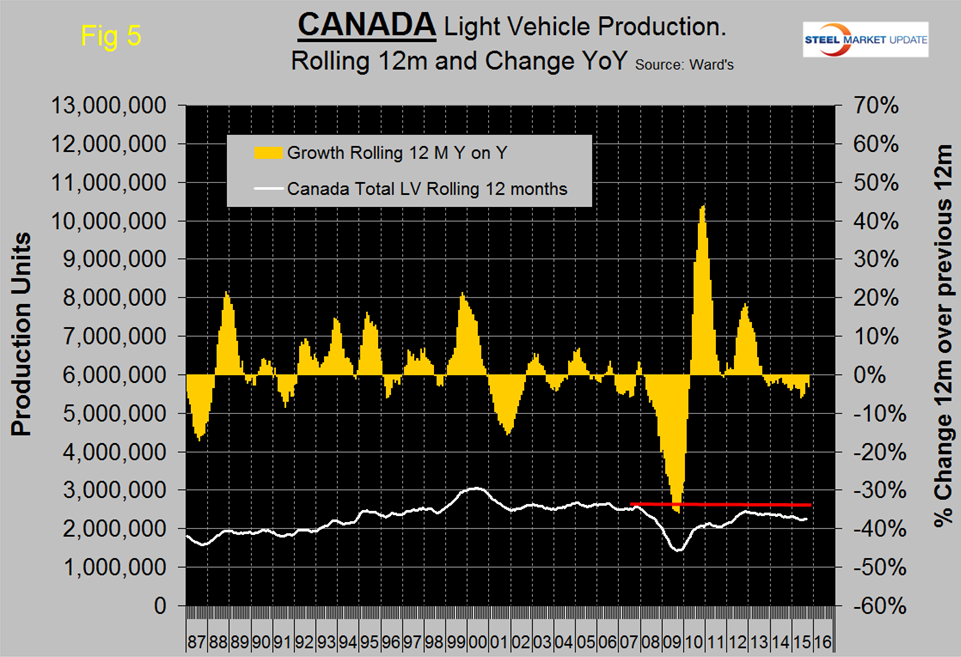
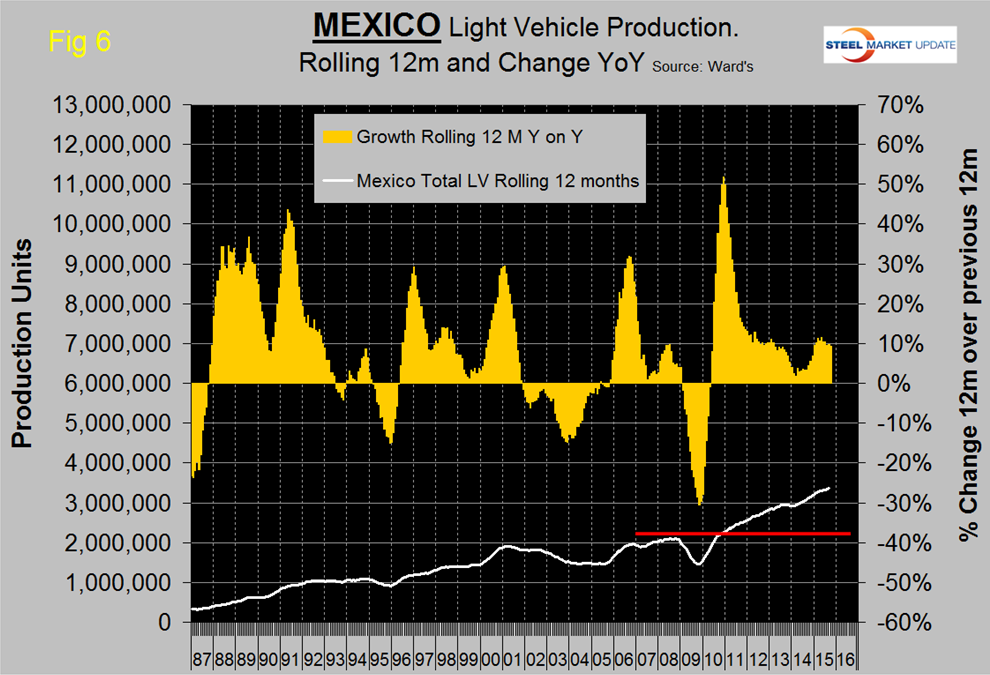
Note the scales are the same to give true comparability and that Mexican growth is surging at more than twice the rate in the US. Canada continues to contract. In the last two years US growth has slowed and contraction in Canada has accelerated. Mexico experienced a strong growth surge last year but has been slowing in the last six months. During the recession Mexico declined by less than the US and bounced back by more during the recovery. This caused Mexico’s production share to surge until Mid-2011 at the expense of the US. So far in 2015, Mexico’s growth rate in total LV production has been at the expense of Canada who have had negative growth for over two years.
In the 12 months through October 15th, compared to the US $ the Canadian $ has depreciated by 13.6 percent and the Mexican Peso by 19.0 percent. These decline must be causing auto assemblers to look at moving production to Mexico in particular. We believe there is spare capacity both sides of both borders for the automotive manufacturers to play this game. This isn’t happening so much in Canada in spite of the depreciation of the Loonie because (in our opinion) the labor relations situation in Canada is causing manufacturers in general to reduce their exposure. US steel is a case in point.
The mix of light vehicles is very different by country (Figure 7).
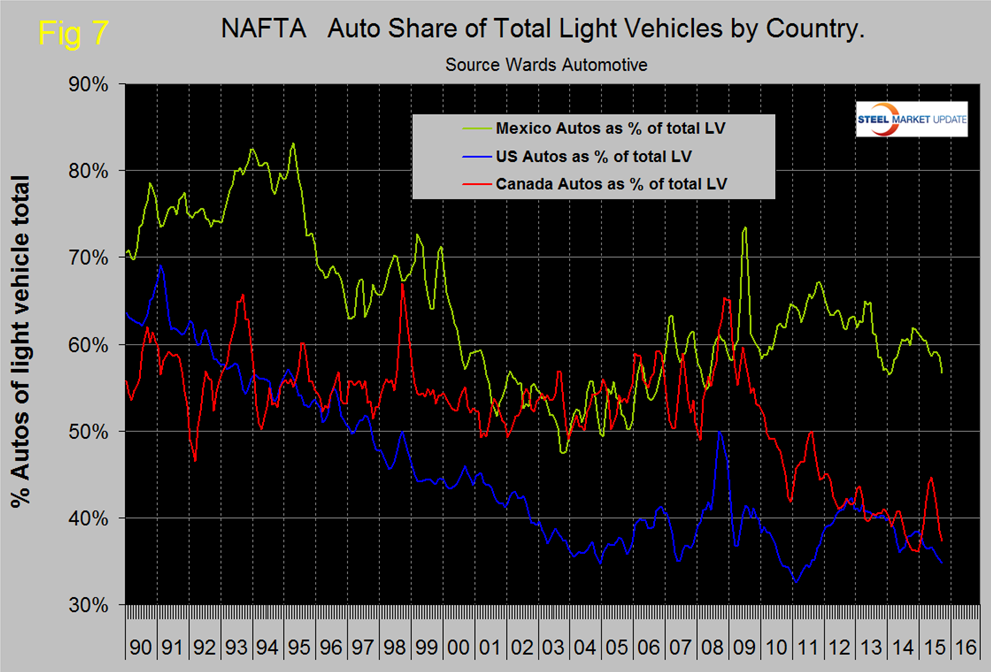
The percentage of autos in the Mexican mix in the last three months was 56.7 percent but only 34.8 in the US and 37.4 percent in Canada. This was the lowest percent of autos in the US mix since July 2011 as buyers preference tilts towards light trucks driven by declining gas prices.
Ward’s Automotive reported this week that total light vehicle inventories in the US increased by 4 days of sales from 55 at the end of August to 59 at the end of September but down by 5 from September last year. Month over month FCA (Fiat Chrysler Automotive) was up by 3 days to 77, Ford was up by 6 days to 67 and GM also at 67 was up by 4 days.
The SMU data file contains more detail than be shown here in this condensed report. Readers can obtain copies of additional time based performance results on request if they wish to dig deeper. Available are graphs of auto, light truck and medium and heavy truck production and growth rate and production share by country.


