

Market Data
October 27, 2015
October Consumer Confidence Continues Erratic Trend
Written by Peter Wright
Consumer confidence continued this year’s highly erratic trend in the October data. As we have reported in earlier write-ups on this subject, 2015 has been tremendously more variable month to month this year than last. In all of 2014 the monthly change ranged from +5.1 to -4.4, this year the range has been +10.7 to -8.9 points. In October the composite declined by 5.0 points to 97.6 but the three month moving average (3MMA) increased by 2.2 points to 100.5 points. This is another example of why not to get too carried away by one month’s result in either direction.
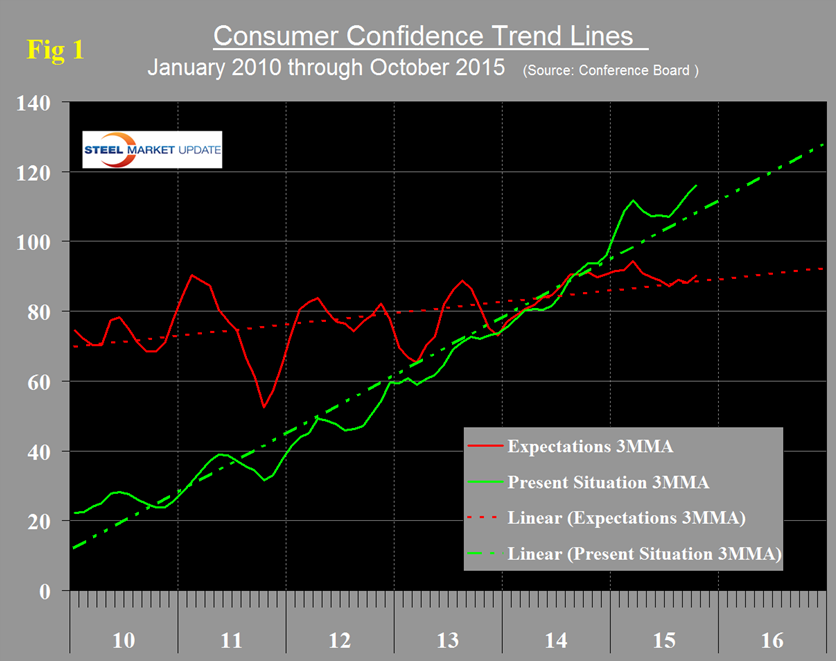
The index is based on 1985 = 100. The composite value of consumer confidence combines the view of the present situation and of expectations for the next six months. The month/month value of both the present situation and expectations declined in September but the 3MMA of both increased. The 3MMA of the present situation continues to be above the five year trend line and that of expectations is now slightly above its 5 year trend line (Figure 1).
The historical pattern of the 3MMA of the composite, the view of the present situation and expectations are shown in Figure 2.
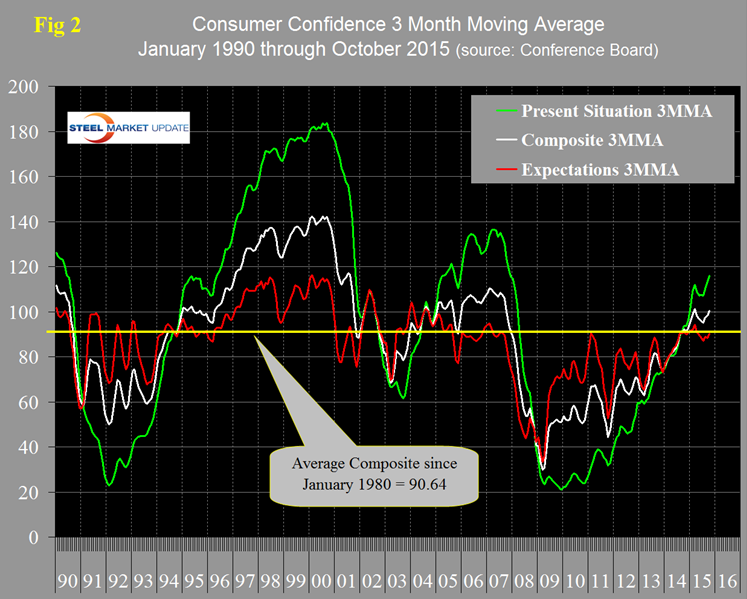
The consistency of the recovery of the composite is looking better than the turn around after the recession in 2003. The present situation component has been much more volatile over each multiyear time span than expectations since our data began 35 years ago with higher highs and lower lows. The view of the present situation moved ahead of that for expectations in October last year for the first time since the recovery began in 2009. If history repeats itself, the view of the present situation will continue to move ahead and widen the differential between it and expectations. On a year over year basis using a 3MMA, the composite at 100.5 is up by 8.3 led by consumer’s view of the present situation which is up by 22.3. Expectations at 90.1 are down 1.0 points year over year (Table 1).
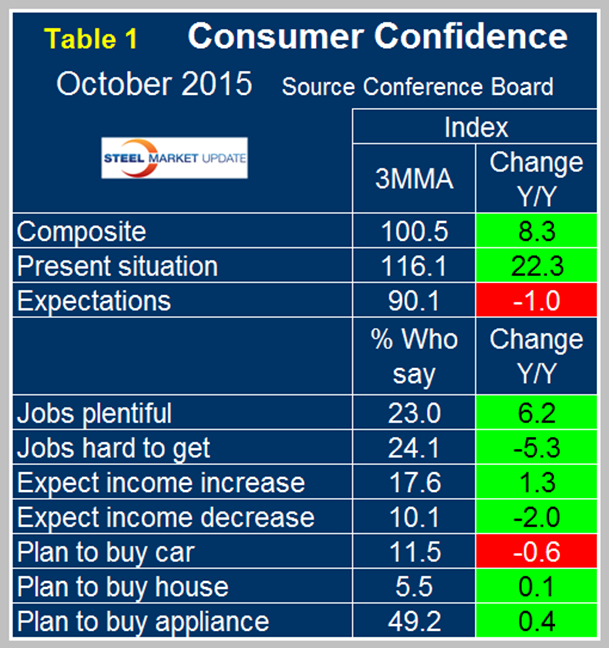
All four of the employment sub-indexes which describe job availability and wage expectations have strengthened for three consecutive month’s year over year as indicated by the color code green. The year over year trends for auto, home and appliance purchase were all negative in March. Intentions to buy an appliance became positive in April, intentions to buy a car became positive in May and in June and July all three were positive year over year. For the first time since April, the y/y intentions to buy a car became negative in August and remained negative through October. Automotive sales are still extremely strong therefore the negative reading in the consumer confidence report is probably a reflection of pent up demand being relieved. Overall in the first ten months of 2015, the Conference Board index has maintained the strongest value since Q3 2007.
The official news release from the Conference Board reads as follows and is entirely based on monthly changes (We don’t believe their conclusions are valid because of the extreme variability of the data but include it here as an example of what not to believe in economic press releases):
The Conference Board Consumer Confidence Index Retreats
The Conference Board Consumer Confidence Index, which had increased moderately in September, declined in October. The Index now stands at 97.6 (1985=100), down from 102.6 in September. The Present Situation Index decreased from 120.3 last month to 112.1 in October, while the Expectations Index edged down to 88.0 from 90.8 in September.
The monthly Consumer Confidence Survey, based on a probability-design random sample, is conducted for The Conference Board by Nielsen, a leading global provider of information and analytics around what consumers buy and watch. The cutoff date for the preliminary results was October 15.
“Consumer confidence declined in October, following September’s modest gain,” said Lynn Franco, Director of Economic Indicators at The Conference Board. “Consumers were less positive in their assessment of present-day conditions, in particular the job market, and were moderately less optimistic about the short-term outlook. Despite the decline, consumers still rate current conditions favorably, but they do not anticipate the economy strengthening much in the near-term.”
Consumers’ appraisal of current conditions was somewhat less positive in October. Those saying business conditions are “good” decreased from 28.1 percent to 26.5 percent, while those claiming business conditions are “bad” increased from 16.4 percent to 18.3 percent. Consumers were also less upbeat about the job market. Those stating jobs are “plentiful” decreased from 24.8 percent to 22.2 percent, while those claiming jobs are “hard to get” edged up to 25.8 percent from 24.9 percent.
Consumers’ optimism about the short-term outlook was more subdued in October. The percentage of consumers expecting business conditions to improve over the next six months was unchanged at 18.1 percent, while those expecting business conditions to worsen inched up to 10.6 percent from 10.4 percent.
Consumers’ outlook for the labor market was slightly less optimistic. Those anticipating more jobs in the months ahead declined moderately from 14.9 percent to 14.5 percent, while those anticipating fewer jobs increased from 15.9 percent to 16.9 percent. The proportion of consumers expecting their incomes to increase declined from 18.7 percent to 18.0 percent, while the proportion expecting a decline increased from 9.9 percent to 10.7 percent.
About The Conference Board
The Conference Board is a global, independent business membership and research association working in the public interest. Our mission is unique: To provide the world’s leading organizations with the practical knowledge they need to improve their performance and better serve society. The Conference Board is a non-advocacy, not-for-profit entity holding 501 (c) (3) tax-exempt status in the United States. www.conference-board.org. (Sources: The Conference Board and SMU analysis)


