

Market Data

October 29, 2015
Oil and Gas Prices and Rotary Rig Count Analysis
Written by Peter Wright
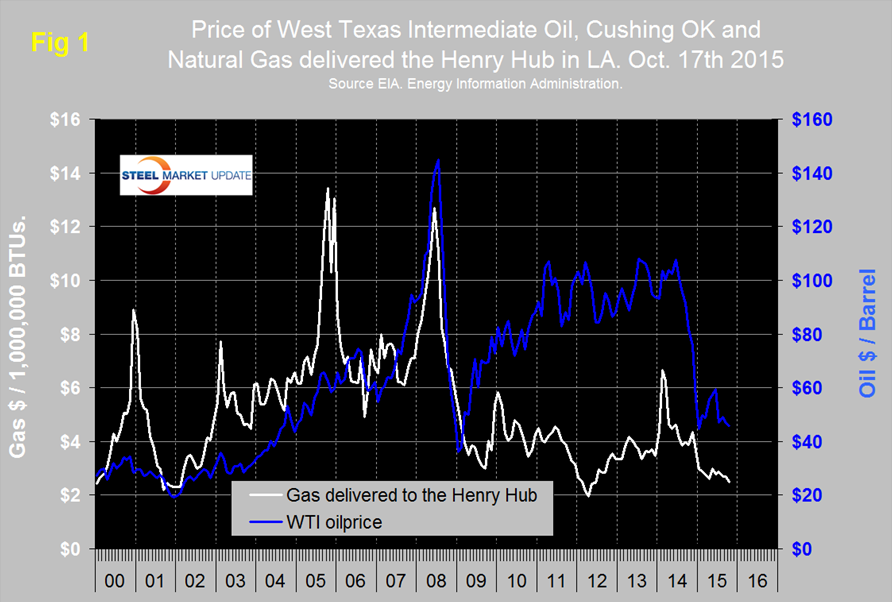
Figure 1 shows historical gas and oil prices since January 2000. The daily spot price of West Texas Intermediate (WTI) closed at $45.91 on October 17th, according to the latest daily figure available from the Energy Information Administration (EIA). Brent closed at $47.51 on the same day. WTI was down from $46.67 in 30 days and down from a recent high of $59.53 on June 15th.
On October 23rd, 3D Asset Management wrote: “Global supply/demand remains out of balance as producers rush supply into a slowing market. The global supply/demand imbalance is at historically wide levels. Either producers have to cut back (whether by voluntary choice or forced to do so by their creditors) or global demand needs to meaningfully pick up. With signs of global growth slowdown, notably out of China, global demand is not likely to accelerate from current levels. OPEC and U.S. energy producers are fighting to see who can hold out the longest. Many of the U.S. producers are highly leveraged and are facing an October redetermination by their creditors where lower oil prices could trigger a massive withdrawal of debt financing. However, it appears many of these companies have gotten a reprieve until next spring as their bankers have decided to roll over their credit lines until the next review. The volatile price swings and blow-out in U.S. credit spreads suggested that the Saudis would prevail as we approached October, but the IMF has released a report suggesting that the Saudis may be closer to the cliff despite being the world’s lowest cost producer. OPEC nations hoped they could squeeze the higher marginal cost producers out of their needed financing, but the race to the bottom will have to continue until bank financing or OPEC public financing dries up.”
The EIA reported on October 21 that crude oil inventories rose for the fourth consecutive week, up 8 million barrels for the week ending on October 16, bringing total stockpiles to 476.6 million barrels. The prior week inventories rose by 7.6 million barrels. These are the highest inventory levels since April 2015. The stockpiles of U.S. crude oil rose for the fourth consecutive week.
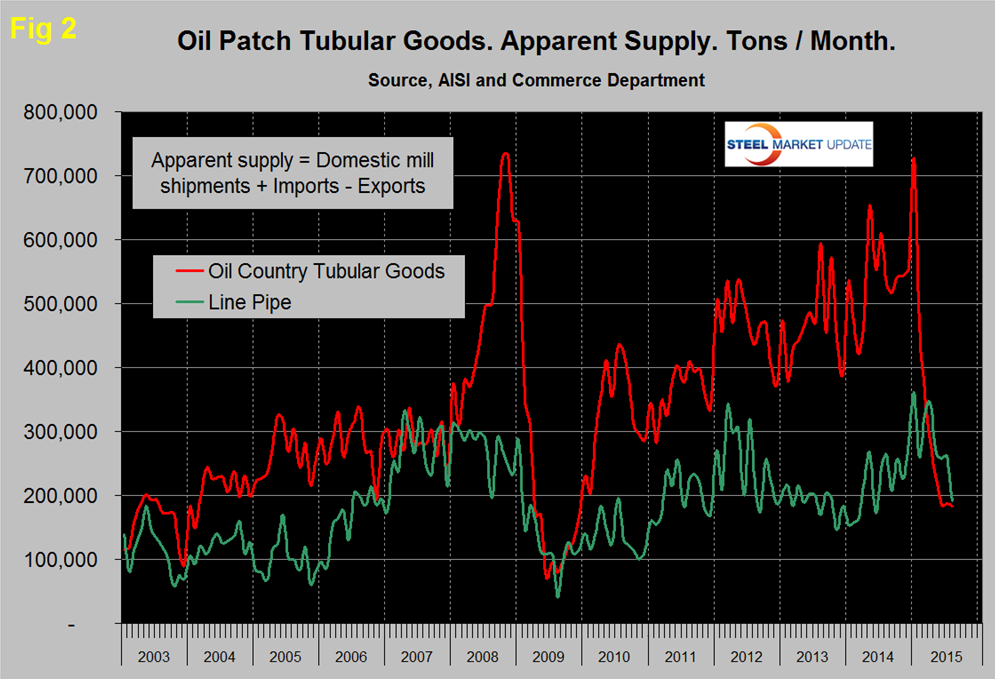
Figure 2 shows the apparent supply of the two main steel tubular products used in oil production from January 2003 through September 2015. OCTD demand averaged about 600,000 tons per month (tpm) from May 2014 through January this year but in three months through September has declined to an average of 185,000 tpm. Since January, line pipe has declined to the level that pertained a year earlier.
Natural gas delivered to the Henry Hub in Louisiana has been hovering in a fairly narrow range all year with a slight downward trend to close at $2.48 October 16th. U.S. power stations are now reported to be generating more power from natural gas than from coal for the first time ever. The price of natural gas has never recovered from the collapse that occurred during the recession and was followed in late 2008 by a rapid decline in the gas rig count. On September 22nd, Danielle Sandusky wrote, “Demand due to electric generation and industrial growth is projected at around 1.7 Bcf/d per year, growing a total of 5-7 Bcf/d in the next 4 years. LNG exports will realistically be approximately 2-5 Bcf/d by 2018. But if the inventory of wells poised to bring gas to market is already as much as 14 Bcf/d and growing, this will easily meet and exceed consumption increases as they come online. Ultimately, the demand side of the equation has little chance of keeping up with the technology gains and massive investment already made in natural gas supply growth. The next few years (2016-2018) will see completion of the midstream infrastructure needed by all of the shale gas activity, and producers will incrementally bring gas online, eventually depleting the inventory of reserved volume. Only then will the continuation of industrial growth and export capacity be able to begin contributing to a recovery in natural gas prices.”
After a partial recovery in 2011 and 2012 the decline in the gas rig count has continued. The collapse in the oil rig count didn’t begin until October 10th last year following the oil price decline that began in June last year. Figure 3 shows the Baker Hughes US Rotary Rig Counts for oil and gas equipment through October 23rd (explanation below).
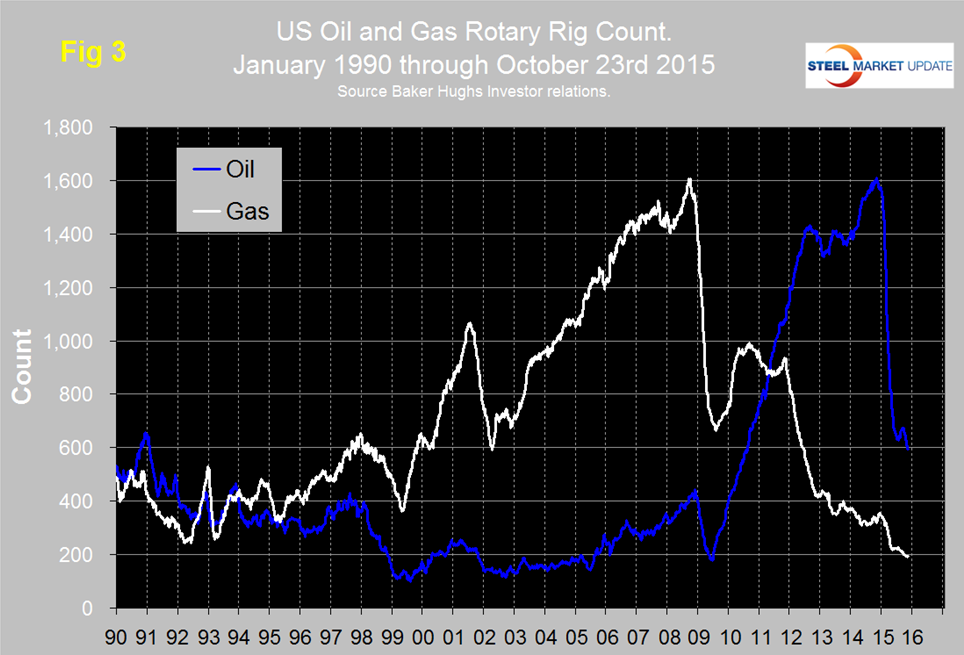
The total number of operating rigs in the US and Canada on October 23rd was 977. Since March 20th the number of active rigs has ranged between 1,207 and 953 and is down by 58.5 percent y/y. The US at 787 on October 23rd was down by 51 in the last month and Canada at 190 was up by 14. On a regional basis in the US the big three states for operating rigs are Texas, Oklahoma and North Dakota. Texas at 346 on October 23rd was down by 16 in the last month, Oklahoma at 90 was down by 15 and North Dakota at 63 was also down by 3. Figure 2 shows that after a brief uptick in oil rigs in the US this summer the decline has returned to its earlier trajectory. The gas rig count continues to decline and in the last six weeks has been below 200 for the first time since our data stream began in January 2008.
Steel Market Update’s view is that based on all we read, low oil prices could be with us for a while and the rig count has clearly not yet bottomed. Inventory adjustments must be playing a large part in the demand decline of OCTGs but we have no information to quantify that effect.
Baker Hughes Rotary Rig Count: These are a weekly census of the number of drilling rigs actively exploring for or developing oil or natural gas in the United States. Rigs are considered active from the time they break ground until the time they reach their target depth and may be establishing a new well or sidetracking an existing one. The Baker Hughes Rotary Rig count includes only those rigs that are significant consumers of oilfield services and supplies.


