

Analysis

November 6, 2015
Construction Expenditures through September 2015 and Dodge Forecast for 2016
Written by Peter Wright
Each month the Commerce Department issues its Construction Put in Place (CPIP) data, usually on the first working day covering activity two months earlier. September data was released on Monday November 2nd.
![]() Construction Put in Place is based on spending work as it occurs, estimated for a given month from a sample of projects. In effect the value of a project is spread out from the project’s start to its completion. Construction starts data published by the Commerce Department for residential construction, by Dodge Data & Analytics and Reed Construction for non-residential and Industrial Information Resources for industrial construction is completely different as in these cases the whole project is entered to the data base when ground is broken. This results in the starts data being extremely spiky which is not the case with CPIP. In September there continued to be a situation where the CPIP data as we report below was very strong but the starts data is less so. Normally starts lead ongoing expenditures by six to nine months. Dodge Data Analytics for who we have great respect, reported that the value of new construction starts in September dropped 5 percent from the previous month to a seasonally adjusted annual rate of $523.7 billion. Decreased activity was reported for both nonresidential building and housing, while the non-building construction sector managed a partial rebound after its August decline. Through the first nine months of 2015, total construction starts on an unadjusted basis were $497.4 billion, up 12 percent from the same period a year ago. Excluding the electric utility and gas plant category, which soared earlier in 2015 due to the start of several massive liquefied natural gas (LNG) terminals, total construction starts during the first nine months of 2015 would be up 5 percent relative to last year.
Construction Put in Place is based on spending work as it occurs, estimated for a given month from a sample of projects. In effect the value of a project is spread out from the project’s start to its completion. Construction starts data published by the Commerce Department for residential construction, by Dodge Data & Analytics and Reed Construction for non-residential and Industrial Information Resources for industrial construction is completely different as in these cases the whole project is entered to the data base when ground is broken. This results in the starts data being extremely spiky which is not the case with CPIP. In September there continued to be a situation where the CPIP data as we report below was very strong but the starts data is less so. Normally starts lead ongoing expenditures by six to nine months. Dodge Data Analytics for who we have great respect, reported that the value of new construction starts in September dropped 5 percent from the previous month to a seasonally adjusted annual rate of $523.7 billion. Decreased activity was reported for both nonresidential building and housing, while the non-building construction sector managed a partial rebound after its August decline. Through the first nine months of 2015, total construction starts on an unadjusted basis were $497.4 billion, up 12 percent from the same period a year ago. Excluding the electric utility and gas plant category, which soared earlier in 2015 due to the start of several massive liquefied natural gas (LNG) terminals, total construction starts during the first nine months of 2015 would be up 5 percent relative to last year.
On October 30th Dodge published their forecast for 2016, the highlights of which are as follows:
“For 2016, total construction starts are forecast to advance 6 percent to $712 billion. Gains are expected for nonresidential building, up 9 percent; and residential building, up 16 percent; while the non-building construction sector slides 14 percent following this year’s substantial jump. If the electric power and gas plant category is excluded, total construction starts next year will be up 10 percent. The pattern by more specific sectors is the following:
• Single family housing will rise 20 percent in dollars, corresponding to a 17 percent increase in units to 805,000 (Dodge basis). Access to home mortgage loans is improving, and some of the caution exercised by potential homebuyers will ease with continued employment growth.
• Multifamily housing will increase 7 percent in dollars and 5 percent in units to 480,000, slower than the gains in 2015 but still growth. Low vacancies, rising rents, and the demand for apartments from millennials will encourage more development.
• Commercial building will increase 11 percent, up from the 4 percent gain estimated for 2015. Office construction will resume its leading role in the commercial building upturn, aided by more private development as well as construction activity related to technology and finance firms.
• Institutional building will advance 9 percent, picking up the pace after the 6 percent rise in 2015. The educational facilities category is seeing an increasing amount of K-12 school construction, supported by the passage of recent school construction bond measures.
• Manufacturing plant construction will recede an additional 1 percent in dollar terms, following the steep 28 percent plunge for 2015 that reflected the pullback for large petrochemical plant starts.
• Public works will be flat with its 2015 amount, as a modest reduction for highways and bridges is balanced by some improvement for the environmental public works categories. A new multiyear federal transportation bill is being considered by Congress, and is expected to achieve passage in late 2015 or during the first half of 2016. The benefits of that bill will show up at the construction site later in 2016 and into 2017.
• Electric utilities and gas plants will fall 43 percent after the sharp 2015 jump. The lift coming from new starts for LNG export terminals will be substantially less, and new power plant starts will recede moderately.”
At SMU we analyze the CPIP provided by the Department of Commerce with the intent of providing a clear description of activity in this steel consuming sector. Please see the end of this report for more detail on how we perform this analysis and structure the data.
Total Construction
We have reported previously that the June, July and August CPIP reports were excellent and on a year/year basis we find that September continued that trend. On a rolling three months basis year over year, June was up by 12.4 percent, July by 13.1 percent, August by 13.4 percent and September by 13.1 percent. .
September expenditures were $90.9 billion which breaks down to $60.8 B of private work, $27.6 B of state and locally (S&L) funded work and $2.5 B of federally funded (Table 1).
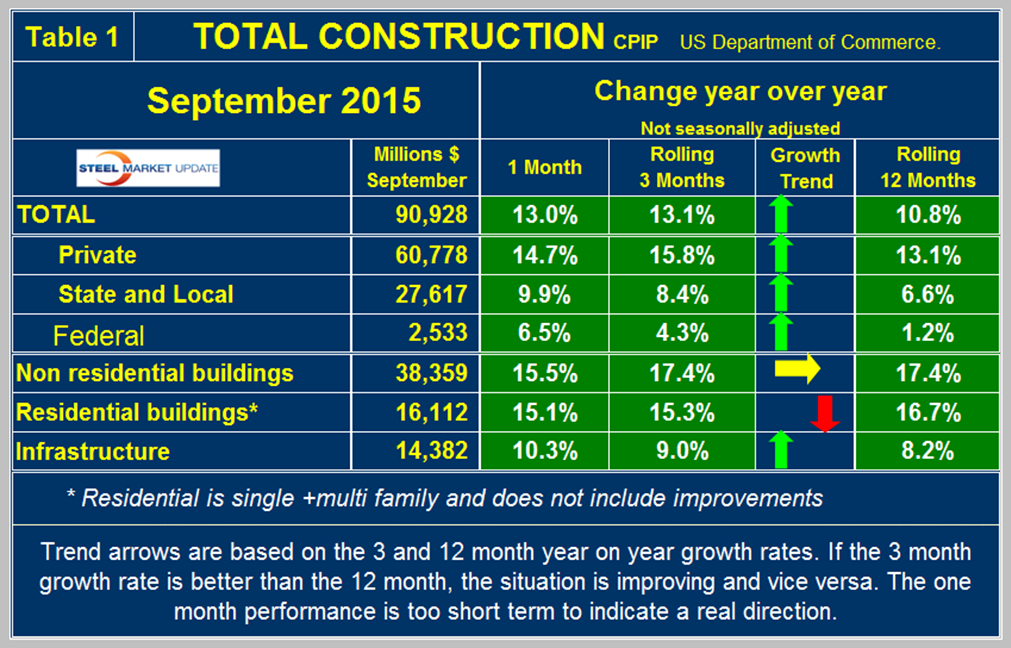
The projected date at which total construction will reach the pre-recession level was Q2 2017 in our May update but the last three months performance could shorten that projection by over a year (Figure 1).
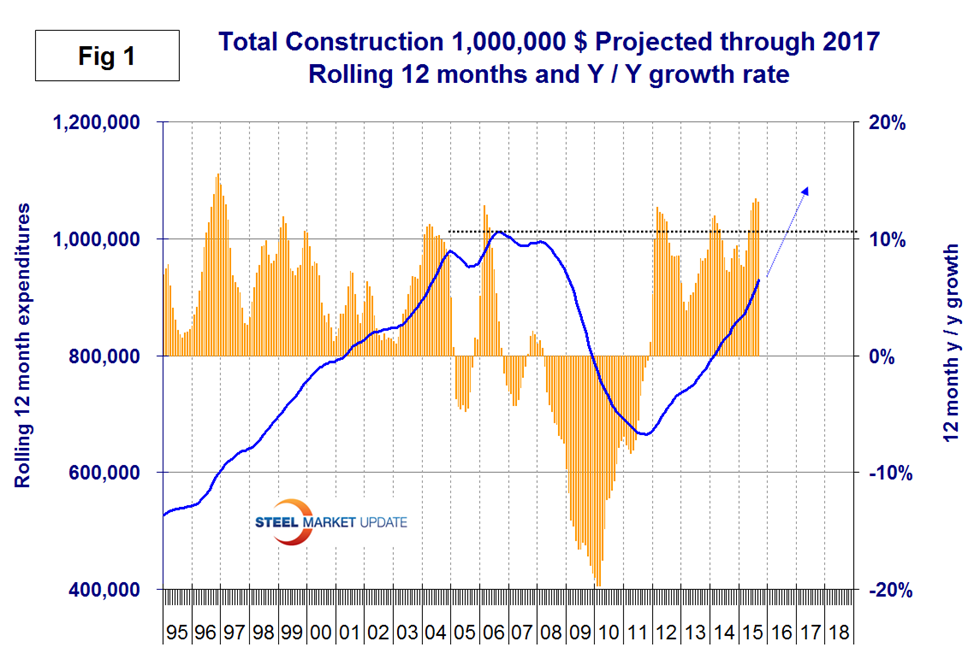
On a rolling three month basis y/y total construction was up by 13.1 percent led by private work up by 15.8 percent. Total construction growth is accelerating since the short term growth (3 months 13.1 percent) is higher than the long term (10.8 percent). We report this as positive momentum. Note this is not a seasonal effect because our y/y analysis removes seasonality. All three categories, private, S&L and federal had positive momentum in the September report. On a rolling 12 month basis Federal construction declined every month for 43 months with September’s report being the first to reverse that trend with a positive 1.2 percent growth rate. We consider three sectors within total construction. These are non-residential, residential and infrastructure. The growth rate of non-residential buildings is a very high at 17.4 percent but its growth rate has flattened. Residential is growing at 15.3 percent with negative momentum. Infrastructure grew 9.0 percent in three months through September year over year with positive momentum. The growth rate of total construction slowed in the first three months of this year but improved in the period April through September as shown by the brown bars in Figure 1. The pre-recession peak of total construction on a rolling 12 month basis was $1,145 B in 12 months through February 2007. The low point was $665.1 B in 12 months through October 2011. The 12 month total through the latest data of September 2015 was $930 B. July, August and September were the first months to exceed $900 B since April 2009 when the recession was gaining traction.
Private Construction
Table 2 shows the breakdown of total private expenditures into residential and non-residential and subsectors of both.
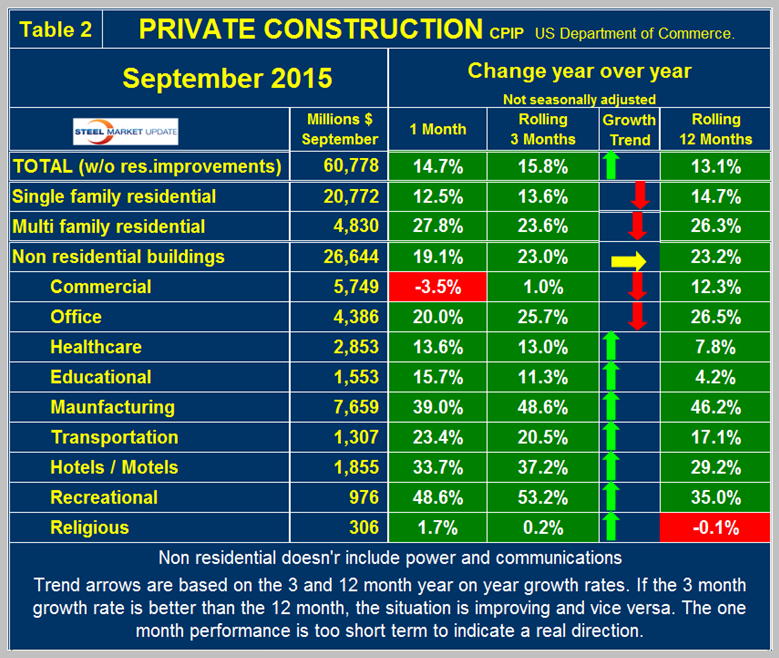
The growth rate of private construction was 15.8 percent in the last three months as shown by the brown bars in Figure 2.
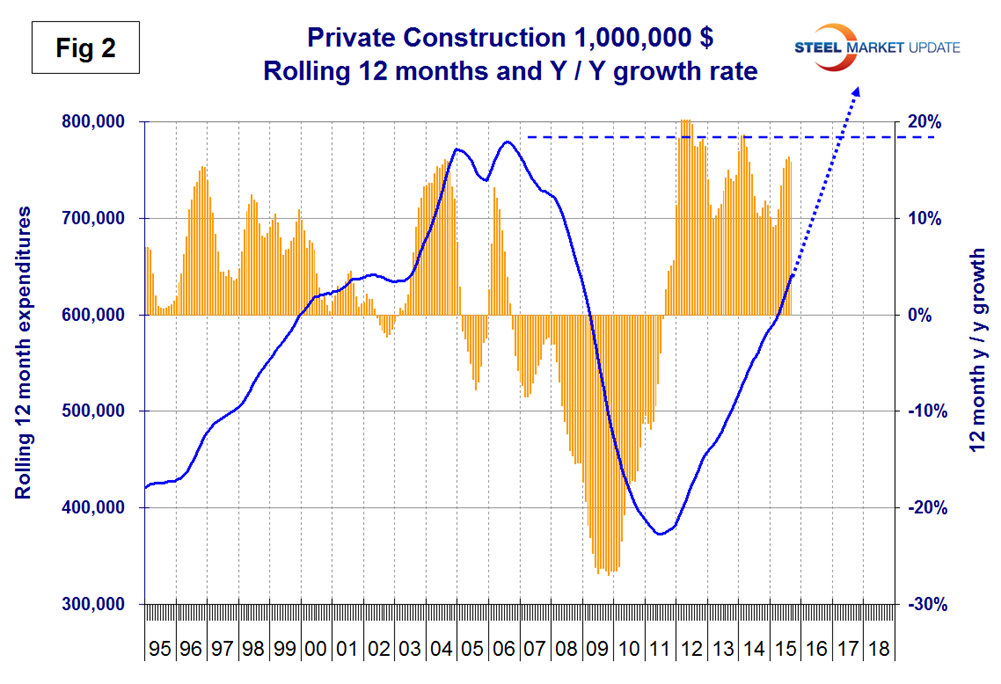
The blue lines inall four graphs in this report are 12 month totals which smooths out seasonal variation. Excluding improvements our report shows that both single and multi-family residential continue to have strong y/y growth but both continue to have negative momentum. The single family expenditures reported here have a rate of growth very similar to that of the Census Bureau housing starts data which have a growth rate of 14.1 percent. The growth of starts being similar though slightly better than current expenditures we are discussing here suggests some positive growth going forward. The growth of multifamily expenditures in this CPIP report is higher than construction starts of this sector reported by the Census Bureau. In this CPIP report multi family is growing at 23.6 percent as the multifamily housing starts data from the Census Bureau is growing at 11.3 percent. Private non-residential building expenditures grew at an extraordinary 23.0 percent rate in three months through September y/y with flat momentum. Within private non-residential, all sectors has positive growth led by recreational and manufacturing and trailed by religious buildings with only a 0.2 percent growth rate. All segments of private nonresidential buildings except commercial (stores) and religious had double digit growth in this latest data.
State and Local Construction
S&L work expanded by 8.4 percent in the rolling three months through September y/y with positive momentum (Table 3).
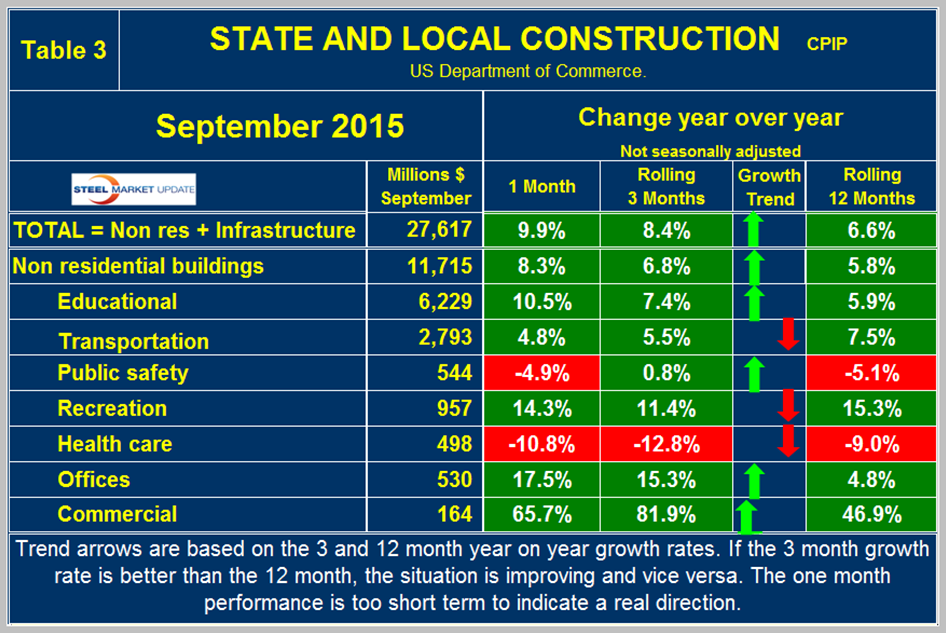
June through September had the highest growth rates for S&L construction since before the recession. Figure 3 shows year over year growth as the brown bars.
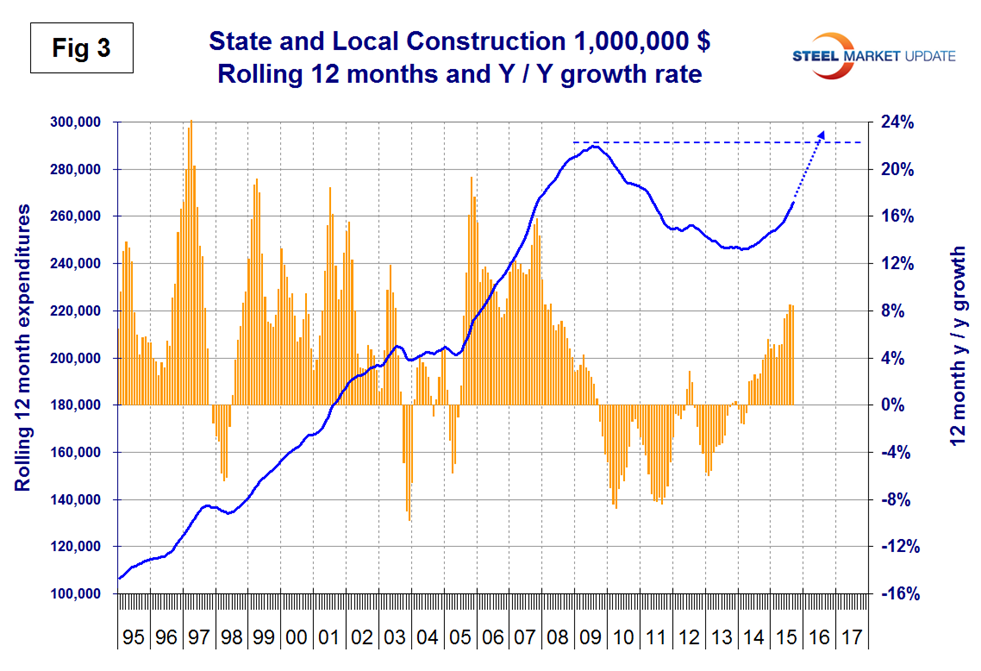
For the first time in this report we have projected a recovery date for S&L construction by extrapolation the recent expansion and find that date to be the middle of next year. Educational buildings are by far the largest sub sector of S&L non-residential at $6.229 billion in September. Recreational buildings have accelerated markedly in the first 9 months of 2015 and grew by 11.4 percent in the latest data. This includes convention centers, sports arenas, theatres and miscellaneous amusements. Table 2 shows that S&L health care expenditures contracted by 12.8 percent but $498 million is much less than the $2.853 billion of private healthcare expenditures which grew at 13.0 percent. August and September were the first months for public safety buildings which includes jails, police, courthouses and fire stations to have positive growth after 32 straight months of contraction. Comparing Figures two and three it can be seen that S&L construction did not have as severe a decline as private work during the recession and that at first private work bounced back faster. S&L expenditure growth has now recovered to the point that at the present rates both sectors will exceed the pre-recessionary peaks within 18 months.
Drilling down into the private and S&L sectors as presented in Tables 2 and 3 shows which project types should be targeted for steel sales and which should be avoided. There are also regional differences to be considered for which data is not available from the Commerce Department. At present the Bureau of Labor Statistics is developing GDP data by state and by sector, including construction and when this is available we will initiate a routine analysis for our subscribers.
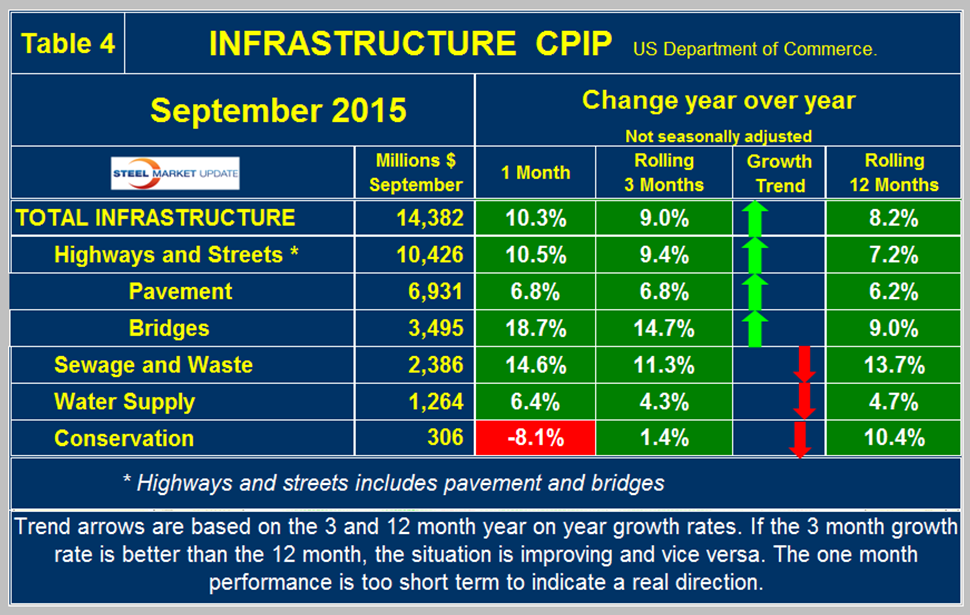
Infrastructure
Expenditures have had positive growth in each of the last 26 months through September with a +9.0 percent result in the latest data with positive momentum. Highway and streets including pavement and bridges accounts for about 2/3 of total infrastructure expenditures and had positive growth for 15 months through February, contracted in March and April then grew by between 8.4 percent and 10.7 percent in the four months through September. Highway pavement is the main subcomponent of highways and streets and had a 6.8 percent positive growth in three months through September. Bridge work contracted every month in the period August through November 2014 but has since expanded every month with an accelerating trend. Bridge work totaled $3.5 billion in the single month of September with a strong 14.7 percent growth rate (Table 4).
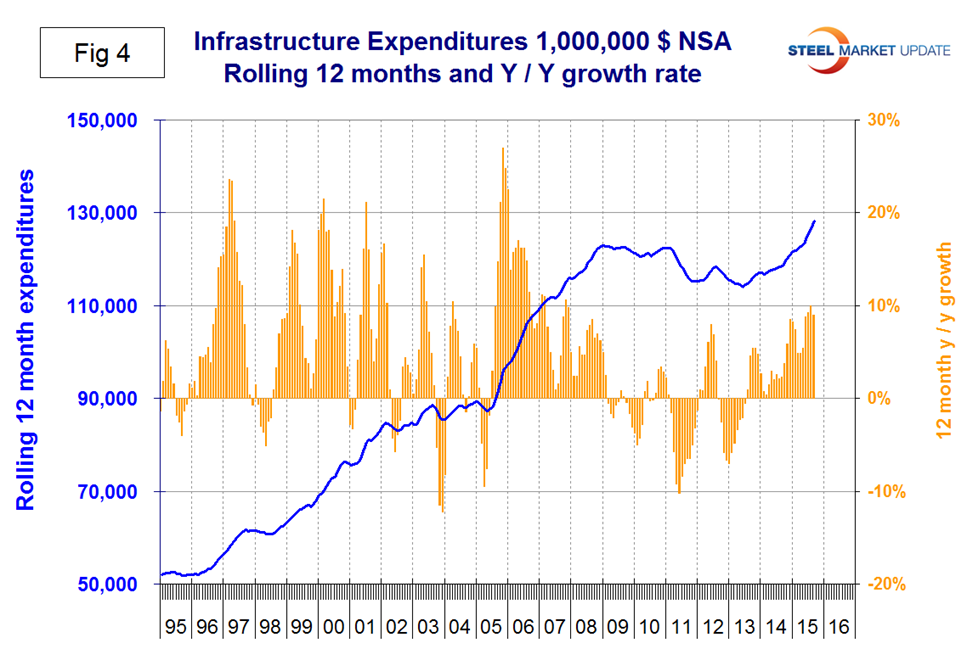
Infrastructure expenditures were slow to respond to the recession due to the magnitude of many of these projects. Growth stopped in 2009 and 2010 but it wasn’t until 2011 that an actual contraction occurred. In the last few months infrastructure expenditures have exceeded the pre-recession high (Figure 4).
Good news from Washington in today’s (November 2nd) blog from “The Hill”; Congress will debate the nation’s infrastructure this week as lawmakers consider long-term highway funding. Only one major item is expected on the House floor so far during the first full week of newly minted Speaker Paul Ryan’s (R-Wis.) tenure. The House is expected to vote on a bill to spend up to $325 billion on transportation projects over the next six years – a departure from repeated last-minute temporary funding extensions. Once it passes the House, negotiators will move toward reconciling differences with their Senate counterparts ahead of a Nov. 20 deadline. Congress has relatively little time to get a long-term highway bill done. The House is scheduled to be out on recess next week for the Veterans’ Day holiday. And will face the Nov. 20 deadline the following week when they return. Lawmakers sent a three-week funding patch to the president’s desk last week, saying it will give the House and the Senate time to reach a deal on a long-term bill. Senate Environment and Public Works Committee Chairman James Inhofe (R-Okla.) said the two chambers should be able to quickly resolve their differences, saying: “I’ve talked to the likely conferees and they are in accord with the idea that we can do this in a matter of hours and not days.”
Total Building Construction Including Residential
Figure 5 compares YTD expenditures for building construction for 2014 and 2015.
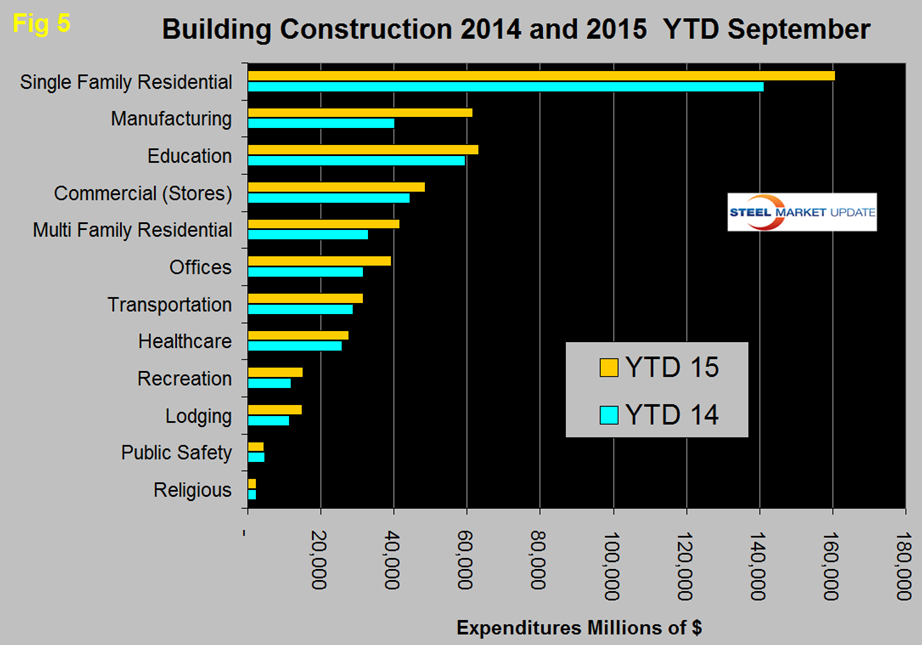
Single family residential is dominant and through September 2015 totaled over $160 billion. On this year over year basis the only sector to be trailing 2014 is public safety which is down by 4.5 percent, at the other extreme manufacturing is up by 53.3 percent.
Explanation: The official CPIP press report gives no appreciation of trends on a historical basis and merely compares the current month with the previous one on a seasonally adjusted basis. The detail is hidden in the published tables which we at SMU track and dissect to provide a long term perspective. Our intent is to provide a rout map for those subscribers who are dependent on this industry to “Follow the money.” This is a very broad and complex subject therefore to make this monthly write up more comprehensible we are keeping the information format as consistent as possible. In our opinion the absolute value of the dollar expenditures presented are of little interest. What we are after is the magnitude of growth or contraction of the various sectors. Data is reported by the Commerce Department on both a seasonally adjusted and non-adjusted basis. Their official commentary is based on adjusted numbers. In the SMU analysis we consider only the non-seasonally adjusted data because we don’t trust seasonal adjustments and in any case our businesses operate in a seasonal world. We eliminate seasonal effects by comparing rolling three month expenditures year over year. CPIP data also includes the category of residential improvements which we have removed from our analysis in the rational that such expenditures are minor consumers of steel.
In the four tables above we present the non-seasonally adjusted expenditures for the most recent month of data. Growth rates presented are all year over year and are the rate for the single months result, the rolling 3 months and the rolling 12 months. The arrows indicate momentum. If the rolling 3 month growth rate is stronger than the rolling 12 months we define this as positive momentum and vice versa. In the text, when we refer to growth rate we are describing the rolling 3 months year over year rate. In Figures 1 through 4 above the blue lines represent the rolling 12 month expenditures and the brown bars represent the rolling 3 month year over year growth rates.


