

Market Data

November 9, 2015
Net Job Creation through October 2015
Written by Peter Wright
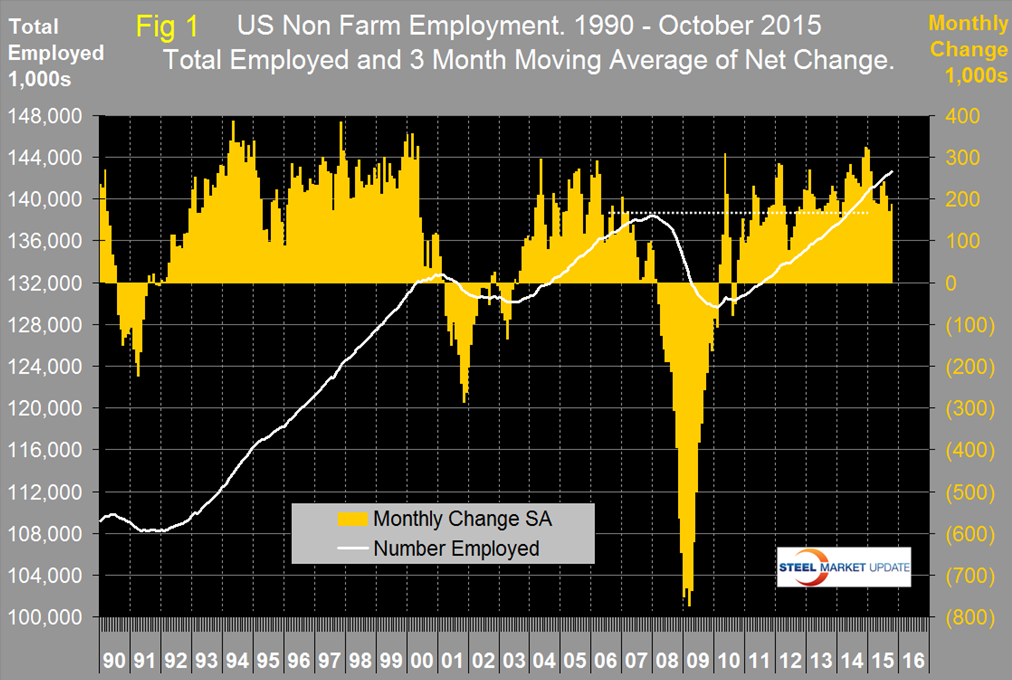
The Bureau of Labor Statistics (BLS) analysis of non-farm employment reported on Friday that 271,000 jobs were added in October, which was well above economist’s consensus expectations. August’s gains were revised up by 17,000, but September’s were revised down by 5,000. This followed September’s result of 137,000 which was well below consensus expectations of about 200,000. The three month moving (3MMA) of gains through October was 187,000. The unemployment rate, U3, calculated from a different survey, fell from 5.1 percent to 5.0 percent. Monthly job gains have averaged 206,000 per month in the ten months of 2015 (Figure 1).
These numbers are seasonally adjusted by the BLS so to examine if any seasonality is left in the data after adjustment we have developed Figure 2 which suggests that the adjustment is far from perfect.
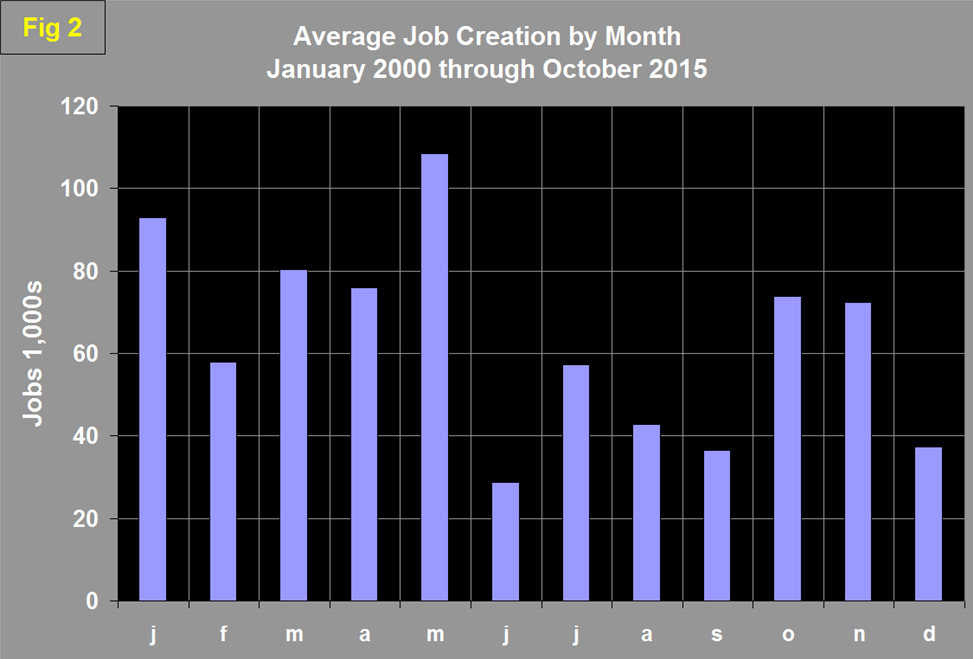
In 16 years the average gain from September to October has been 102 percent, this year the gain was 98 percent so shouldn’t have been an upside surprise. If history is an accurate guide we can expect a job gain of about 265,000 in November. Total nonfarm payrolls are now 4,289,000 more than they were at the pre-recession high of January 2008. In October the average workweek for all employees on private nonfarm payrolls remained at 34.5 hours. The manufacturing workweek edged up by 0.1 hour to 40.7 hours, and factory overtime edged up by 0.1 hour to 3.3 hours. The average workweek for production and non-supervisory employees on private nonfarm payrolls edged up by 0.1 hour to 33.7 hours. Over the past 12 months, average hourly earnings have risen by 2.2 percent.
Table 1 slices total employment into service and goods producing industries and then into private and government employees.
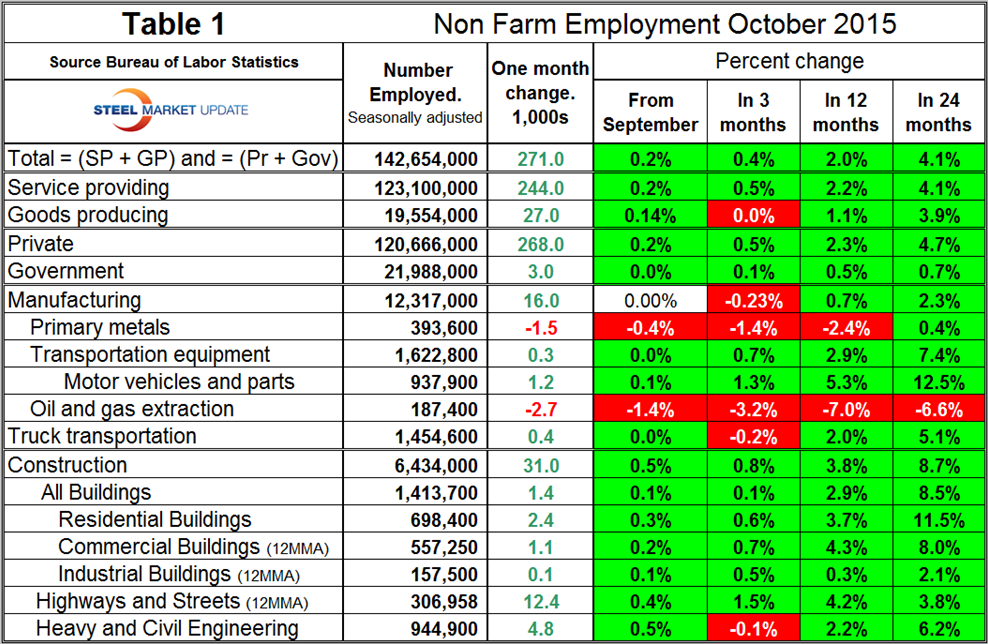
Total employment equals the sum of private and government employees. It also equals the sum of goods producing and service employees. Most of the goods producing employees work in manufacturing and construction and the major components of these two sectors are also shown in Table 1. In October, 268,000 jobs were created in the private sector and 3,000 in government. All of the government growth was at the state level (5,000) with zero jobs created in local government and 2,000 shed by the federal government. Since February 2010, the employment low point, private employers have added 13,493,000 as government has shed 488,000. In October service industries expanded by 244,000 as goods producing industries added 27,000 people. Since February 2010, service industries have added 11,078,000 and goods producing 1,927,000 positions. Table 1 shows that manufacturing gained 16,000 jobs in September. In all of 2015, manufacturing has actually lost 1,000 jobs, therefore is statistically unchanged, another indication along with the ISM Manufacturing Index and the Federal Reserve Industrial Production Index that growth in this sector has slowed. Note the subcomponents of both manufacturing and construction shown don’t add up to the total because we have only included those that have most relevance to the steel industry. Primary metals lost 1,500 jobs in October, is down by 2.4 percent in the last 12 months and has not had a single positive growth month in 2015. Motor vehicles and parts gained 1,200 jobs in October, oil and gas extraction has had negative job creation in all four time periods examined in Table 1. Truck transportation gained 400 jobs in October but is down by 2,400 in the last three months. Construction added 31,000 jobs in October which was the best result since February. Some of the major construction sub categories are routinely reported one month in arrears which distorts the data in Table 1. These include, industrial buildings, commercial buildings and highways and streets.
The Associated General Contractors of America had the following to say about October’s result: “Construction firms added 31,000 workers in October as the industry’s unemployment rate declined to 6.2 percent amid robust demand for construction. Association officials noted that construction employment is now at the highest level since February 2009 as the sector continues to recover from the downturn. The industry continues to recover while the hiring slowdowns it experienced during the summer were prompted more by labor shortages than they were any slump in demand,” said Ken Simonson, the association’s chief economist. “Construction firms appear to have had an easier time finding workers in October than they did during the summer. Construction employment totaled 6,434,000 in October, the most since February 2009, and is up by 233,000 jobs compared to a year ago, a 3.8 percent increase. Residential construction increased by 6,000 in October and by 99,100, or 4.2 percent, compared to a year ago. Nonresidential construction employers added 24,900 jobs for the month and 133,800 jobs compared to last October, a 4.5 percent increase. The number of unemployed jobseekers in September who last worked in construction totaled 534,000, the lowest figure for October since 2006. The unemployment rate for such workers was 6.2 percent, the lowest October number since 2007. Meanwhile, Census Bureau data released on November 2 showed that the growth in construction spending accelerated to a seven-year high of 14.1 percent in the latest 12 months, September 2014 to September 2015.”
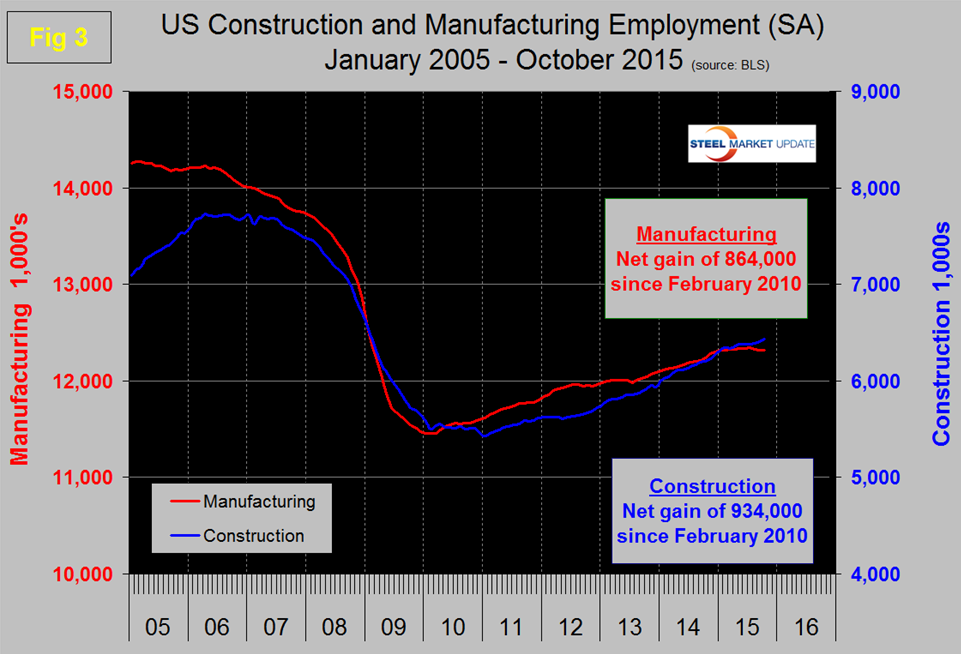
Since the bottom of the employment recession, construction has now crept ahead of manufacturing as a job creator. Having said that, it must be recognized that productivity increases in manufacturing are very much greater than they are in construction. As an example of this, employment in the manufacture of automotive vehicles and parts is down by 29 percent from early 2000 but auto assemblies in the US are only down by about 8 percent in the same time frame. Construction has added 934,000 jobs and manufacturing 884,000 since the recessionary employment low point in February 2010 (Figure 3).
Based on the total construction analysis that we report in our CPIP update, we assume that construction jobs will continue to expand assuming labor can be found. Construction has been holding back steel demand but that should increasingly not be the case.
The official unemployment rate known as U3, decreased from 5.5 percent in May to 5.3 percent in June and July then fell to 5.1 percent in August, remained at 5.1 percent in September and fell to 5.0 percent in October. Among the major population groups, the unemployment rates for adult men (4.7 percent), adult women (4.5 percent), teenagers (15.9 percent), whites (4.4 percent), blacks (9.2 percent), Asians (3.5 percent), and Hispanics (6.3 percent) showed little or no change in October. This number doesn’t take into consideration those who have stopped looking. The more comprehensive U6 unemployment rate decreased from 11.3 percent in January to 9.8 percent in October (Figure 4).
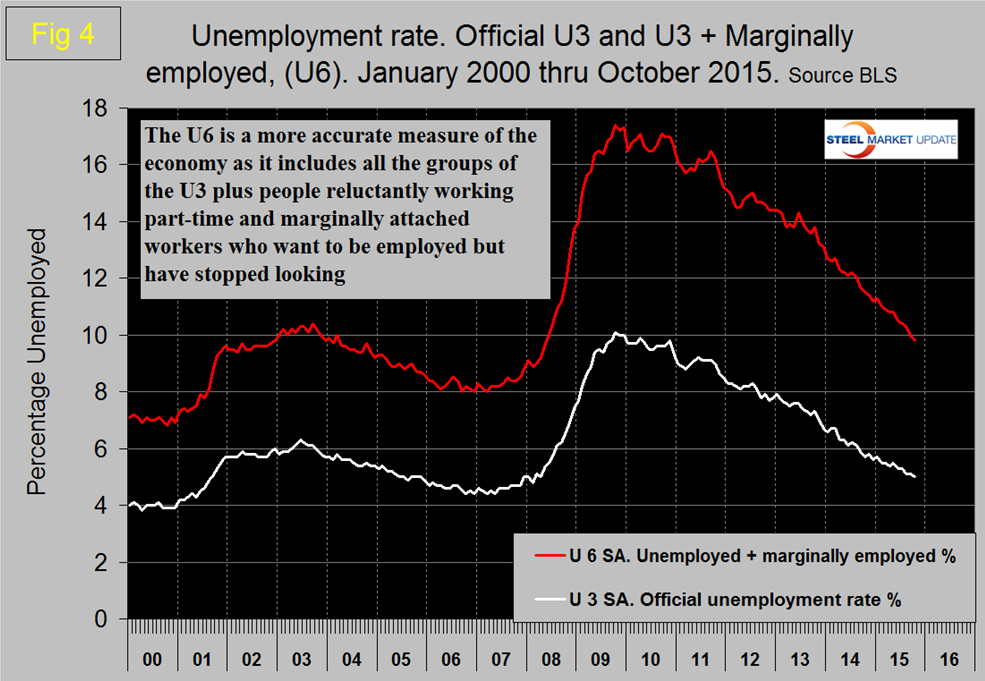
U6 includes workers working part time who desire full time work and people who want to work but are so discouraged that they have stopped looking. The differential between these rates was usually less than 4 percent before the recession but is still 4.8 percent. The good news is that the gap is slowly closing.
So far in 2015 there has been an increase of 2,090,000 full time jobs and a decrease of 323,000 part time jobs. Figure 5 shows the rolling 12 month total change in both part time and full time employment.
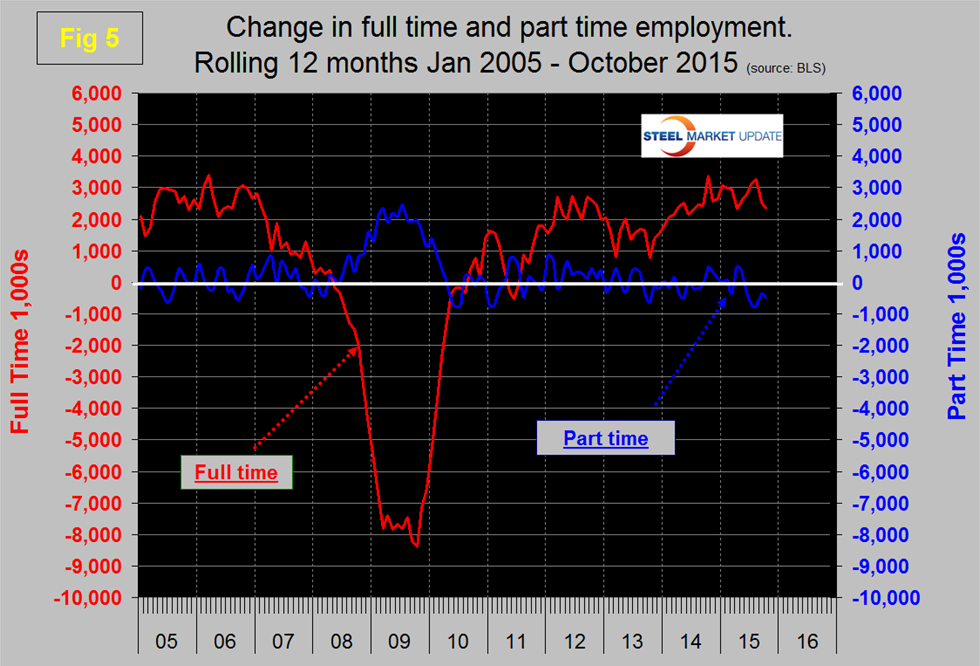
Frequently in the press we read that a large part of job creation is in part time employment. This is not the case but because the part-time numbers are extremely volatile we have to look at longer time periods than a month or even a quarter to get the picture.
The job openings report known as JOLTS is reported on about the 10th of the month by the Federal Reserve and is over a month in arrears. Figure 6 shows the history of unfilled job openings which have skyrocketed this year to levels not seen since the data series was initiated in 2000.
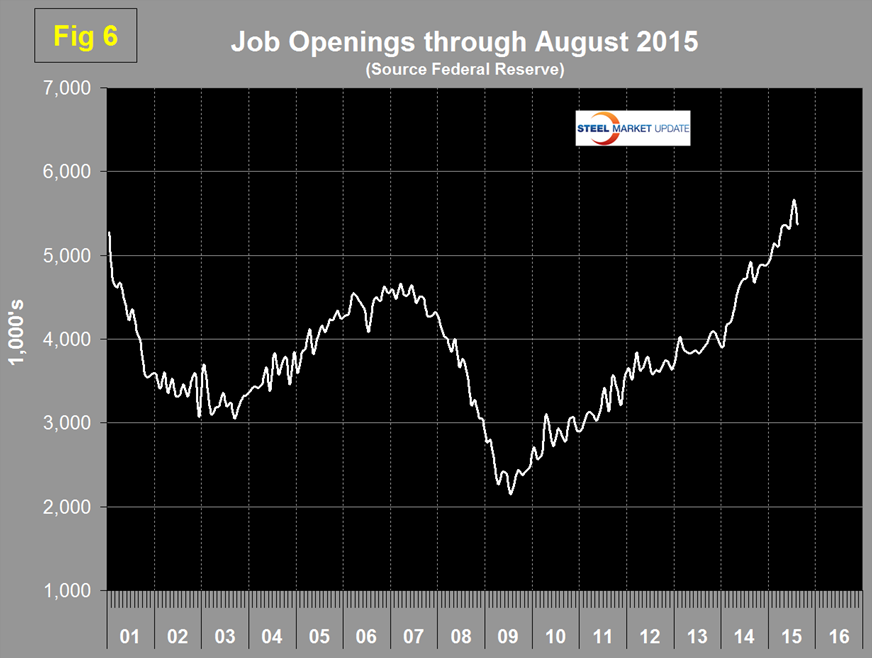
The previous high was 5.25 million at the end of 2000; in 2015 we have seen a surge from 4.965 million in January to 5.370 million in the latest report.
SMU Comment: It’s inescapable that the rate of growth of manufacturing is slowing but this should not be confused with contraction. Construction that has been holding steel consumption back is growing rapidly and with a slowly expanding manufacturing sector, steel demand should improve. The employment report is a useful reality check on our other manufacturing and construction data but needs to be considered on a more extended time base than a single month or even three months. What we are looking for is the long term trends that point to current and future steel demand.


