

Market Segment

November 16, 2015
Service Center Intake, Shipments and Inventory through October 2015
Written by Peter Wright
Based on Steel Market Update (SMU) analysis of the recently released MSCI service center inventory and shipment data, total service center carbon steel shipments increased by 104,700 tons in October to 3.201 million tons. Shipping days at 22, were up by one from September. On a tons per day basis (t/d) shipments decreased from 147,900 tons in September to 145,900 tons in October.
![]()
In the twelve years since 2004 October shipments on average have been down by 3.4 percent from September, this year shipments were down by 1.4 percent. Therefore on a long term basis (12 years) the October performance compared to September was better than normal. This observation is only intended to give a long term perspective because MSCI data is extremely seasonal and we need to get past that before commenting in detail on current results. Figure 1 demonstrates this seasonality and why comparing a month’s performance with the previous month is usually misleading.
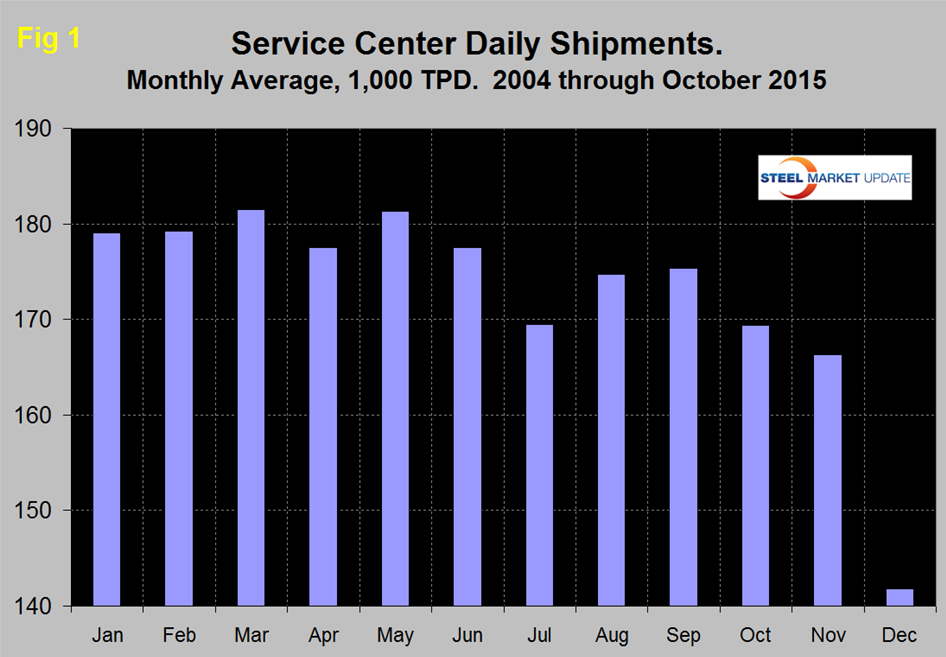
We are now entering a period when shipments in t/d will decrease for three straight months before bouncing back in January. In the SMU analysis we always consider year over year changes to eliminate seasonality. Table 1 shows the performance by product in October compared to the same month last year and also with the average t/d shipments for October in the last three years. We then calculate the percent change between October 2015 and October 2014 and with the 3 year October average.
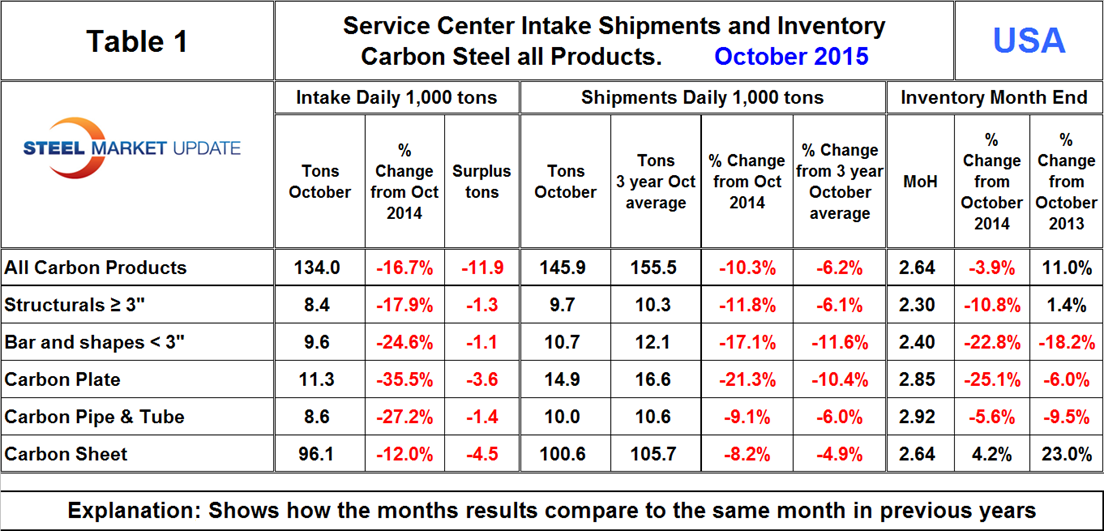
We hope this gives an undistorted view of market direction. In October intake at 134,000 tons was 11,900 tons less than shipments. This was the first month of deficit after three straight months of surplus. The intake deficit was across the board for all product groups. Compared to last October, intake was down by 16.7 percent overall and all product groups were down by double digits.
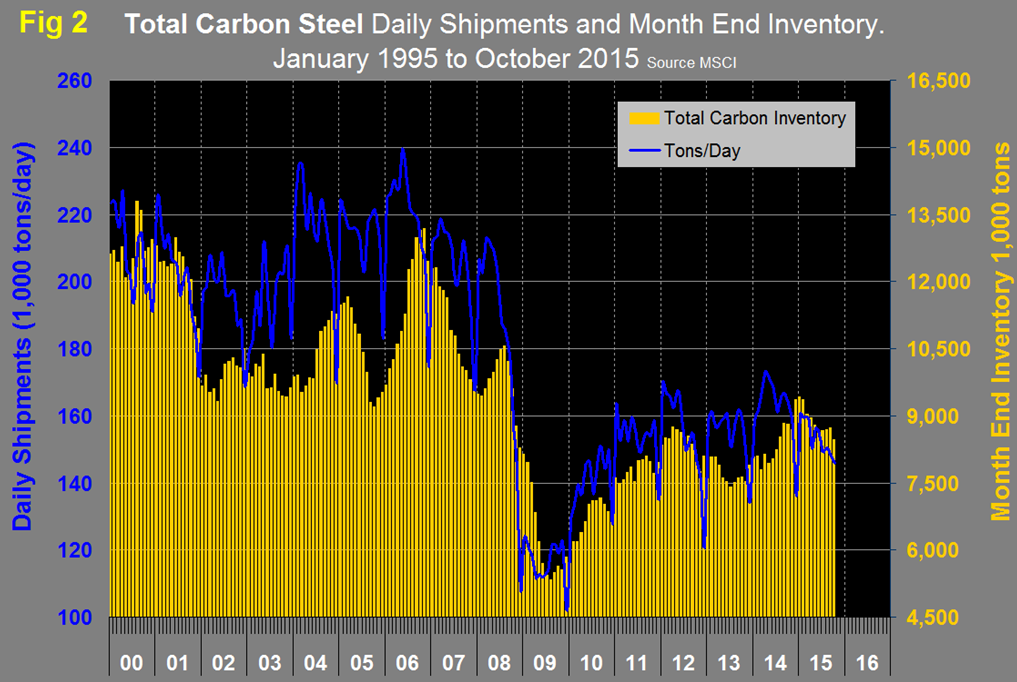
Shipments of all products on a t/d basis were down by 10.3 percent from October last year and were 6.2 percent less than the average October shipments for 2015, 2014 and 2013. The fact that the single month y/y growth comparison is worse than the three year comparison is an indication that momentum is negative and the contraction is accelerating. Figure 2 shows the long term trends of daily shipments and month end inventory since 2000.
Daily shipments had a post recessionary high of 173,300 in April last year and have had a downward trend ever since. In October shipments of all products except sheet and tubulars were down by double digits year over year. Plate, bars and light shapes had the highest rate of growth contraction.
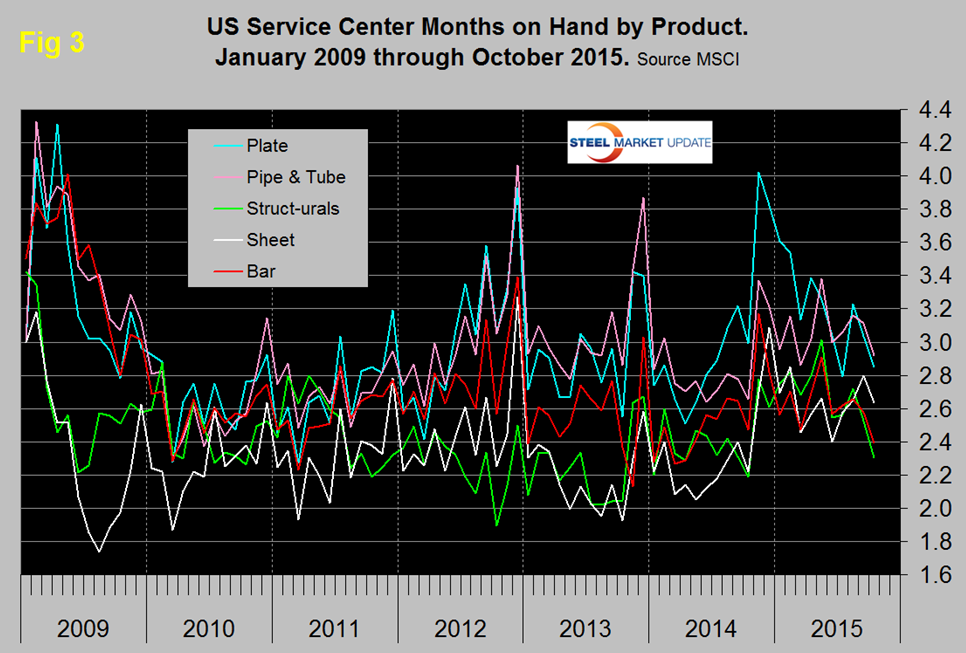
October closed with months on hand (MoH) of 2.64, down from 2.81 at the end of September. All products except sheet had a y/y decrease in MoH. Figure 3 shows the MoH by product monthly since January 2009. Plate has had a particularly strong inventory decline since the end of last year.
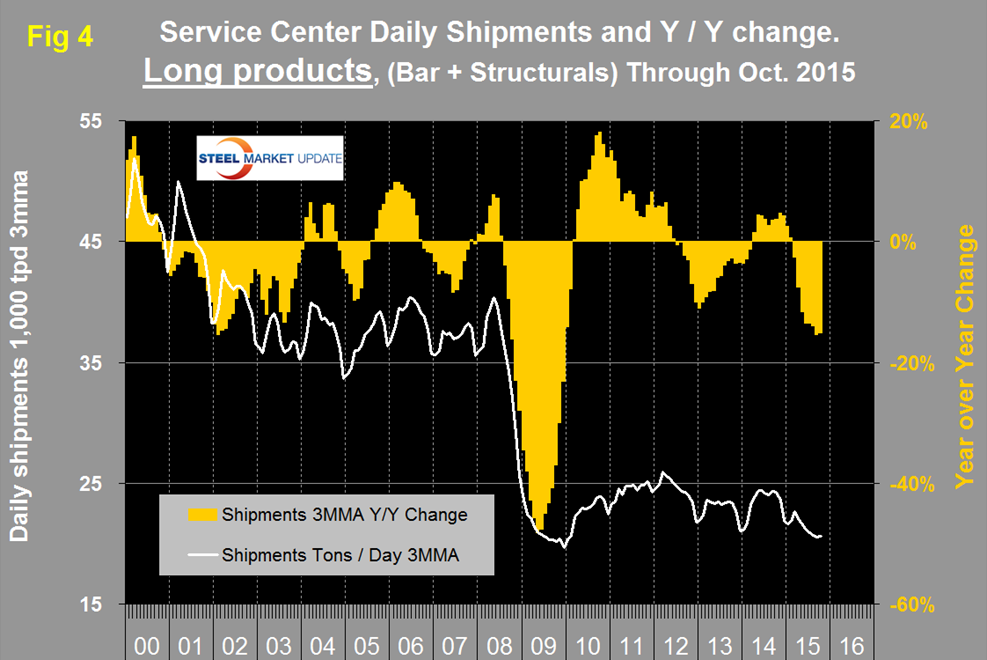
There continues to be a wide difference between the performances of flat rolled (sheet + plate) and long products (structurals + bar) at the service center level. Long products have had a very poor recovery from the recession. On a 3MMA basis y/y, the growth of long product shipments was negative for 21 straight months until April last year which was the first of eleven months of growth. However in March on a y/y basis shipment growth returned to negative territory and has stayed there ever since with a deteriorating trend (Figure 4).
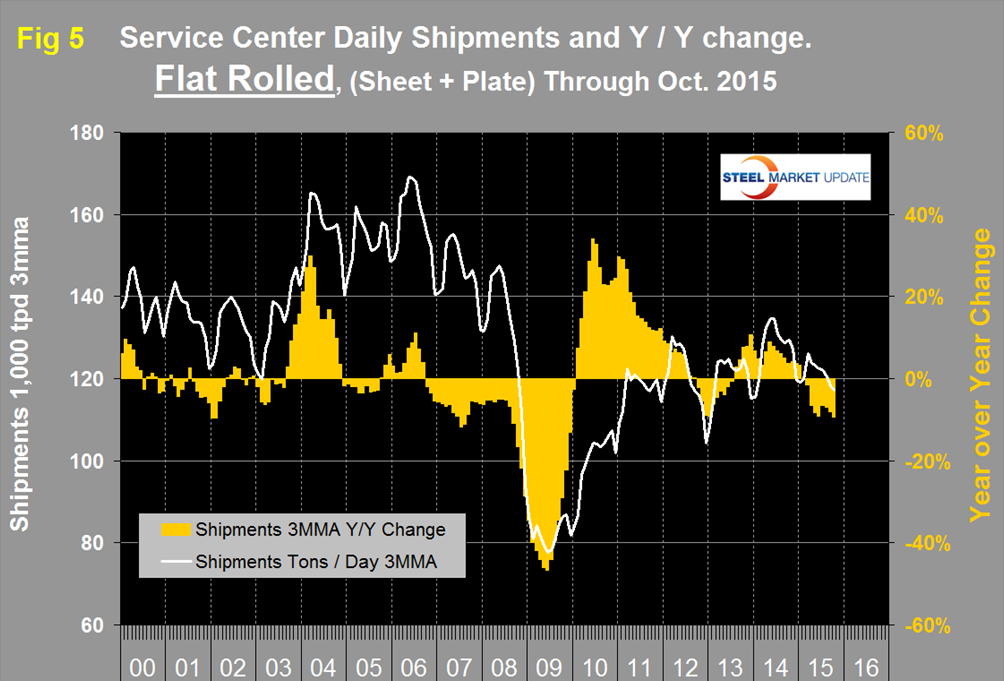
Considering the improving construction statistics, we have no explanation for this dismal and deteriorating long product performance. Flat rolled has had a much better recovery since mid-2009 and had positive y/y growth for 18 straight months through January this year. In February growth slowed to zero, in March came in at negative 1.6 percent and has been negative ever since (Figure 5).
In 2006 and 2007, the mills and service centers were operating at maximum capacity. Figure 6 takes the shipments by product since that time frame and indexes them to the average for 2006 and 2007 in order to measure the extent to which service center shipments of each product have recovered.
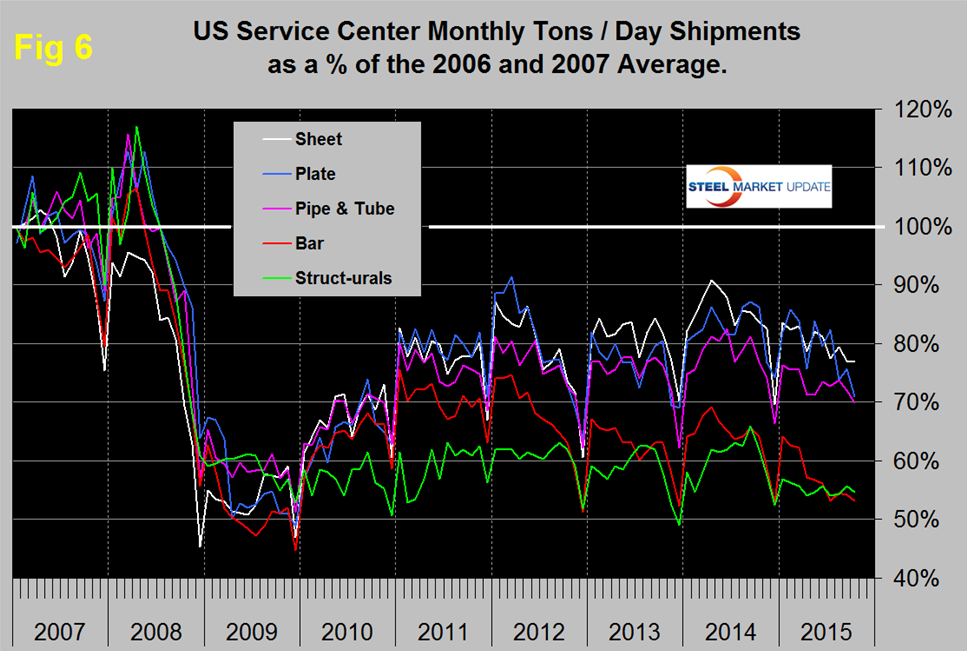
Again it can be seen that bar and structurals have the worst record and that bars and light shapes have suffered a major deterioration this year. Sheet, plate and tubulars are now showing a deteriorating trend since mid-year. The total of carbon steel products is now at 68.7 percent of the shipping rate that existed in 2006 and 2007, with structurals and bar at 54.6 percent and 53.2 percent respectively. Sheet is at 76.9 percent, plate at 71.0 percent and tubulars at 69.9 percent.
MSCI uses product nomenclature flat and plate. In this analysis at SMU we replace the term flat with sheet. By our interpretation of the MSCI’s data their definition of “flat” is all hot rolled, cold rolled and coated sheet products. Since most of our readers are sheet oriented we have removed plate from Figure 5 to highlight the history of sheet products which are shown in Figure 7.
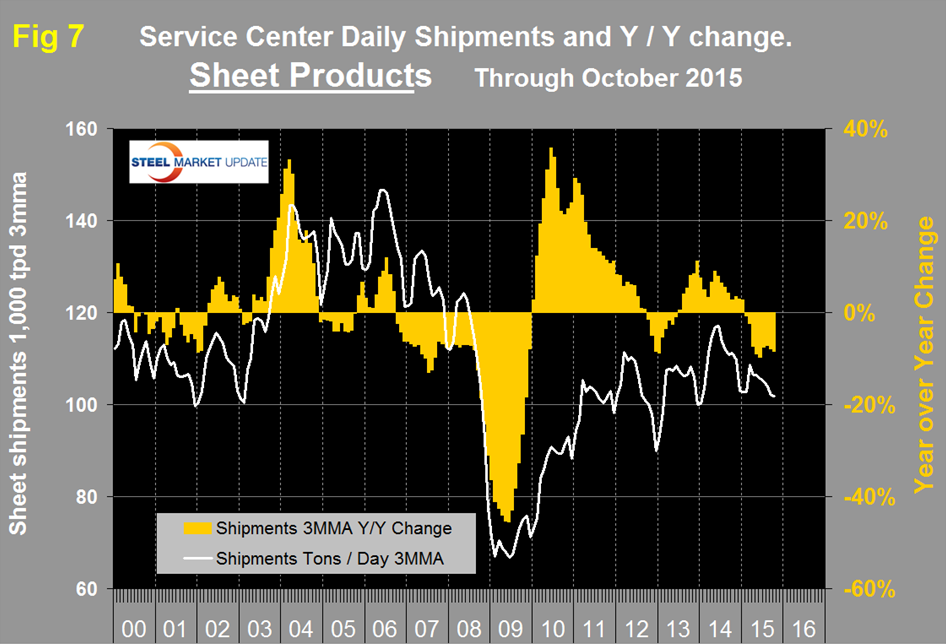
Following the strong post-recession recovery, sheet products experienced 9 months of decline from October 2012 through June 2013. This was followed by eighteen months of growth through January this year but February slipped back into negative territory at -0.7 percent year over year and has been negative ever since.
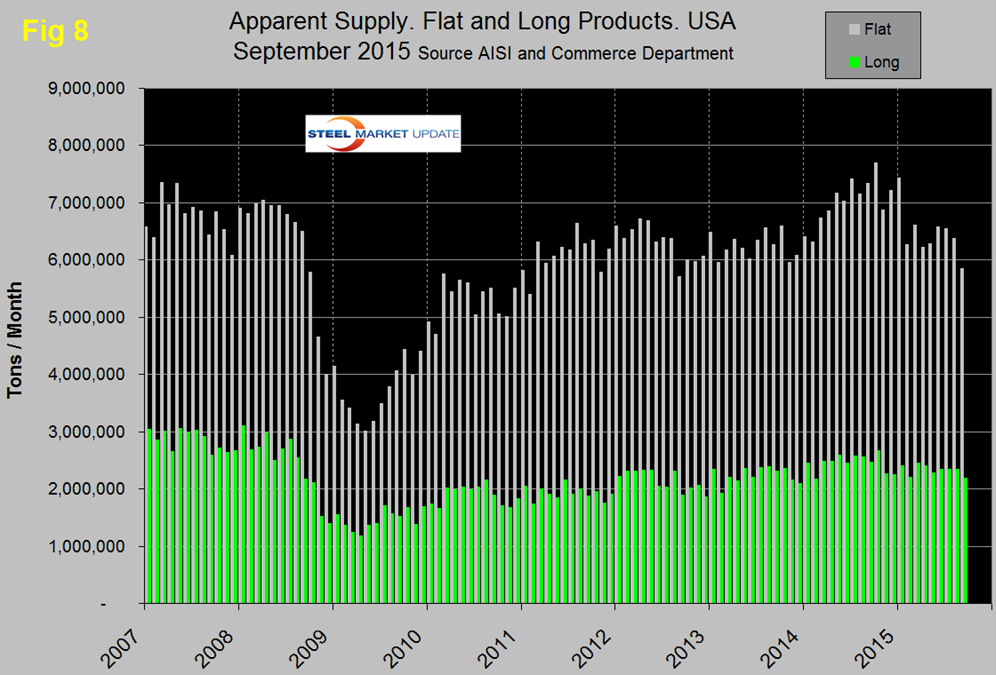
SMU Comment: Last month we reported that the September data was ugly and the October update is no better. The only glimmer is that this year October shipments declined by less than normal from September but on a year over year basis both shipments and intake were down for all products. Inventories in terms of MoH were also down y/y in October for all products except sheet which was up by 4.2 percent. Figures 2, 4, 5 and 7 show that there has been a distinctly negative decline in shipments for all products since the middle of last year. This MSCI data is now looking more like our report of total supply to the market which is based on AISI shipment and import data. Total supply of flat rolled products peaked in October last year and from January through August didn’t change much. However there was a significant decline in September as shown in Figure 8. Note: this supply data is one month behind the MSCI information.
The SMU data base contains many more product specific charts than can be shown in this brief review. For each product we have ten year charts for shipments, intake, inventory tonnage and months on hand. Some readers have requested these extra charts for a particular product and others are welcome to do so.


