Market Segment

November 17, 2015
U.S. Service Center Flat Rolled Steel Inventories Drop
Written by John Packard
Shipments of all steel products out of the U.S. based steel service centers totaled 3,363,900 tons, according to the Metal Service Center Institute (MSCI) in data released on Monday. Total tonnage was up 3.2 percent compared to September but was down 14 percent year-over-year. The daily shipment rate was 152,900 tons which was 1.5 percent lower than the prior month which had one less shipping day and 10.1 percent lower than October 2014.
Total steel inventories were reported to be 8,918,500 tons which is down 3.0 percent compared to the 9,192,400 tons at the end of the prior month. Inventories at the end of October were 4.2 percent lower than October 2014.
The number of days of inventory on hand (all products) dropped to 2.7 months from the 2.8 months reported for the month of September. The 10-year average for the month of October is 2.4 months of inventories on the floor.
Carbon Steel (Long & Flat) Totals
Total shipments of carbon steel (both flat rolled and long products) was 3,210,100 tons for the month. This represents an increase of 3.4 percent compared to the 3,105,400 tons shipped during the month of September but was 14.2 percent below October 2014 shipment levels.
October had 22 shipping days and the average daily shipment rate was 145,913 tons per day. This was down from the 147,876 tons per day shipped during the month of September (21 day month) and is well below the 162,713 tons per day rate of October 2014 (23 day month).
Inventories of carbon steel totaled 8,465,000 tons and were down 3.0 percent from the 8,727,700 tons reported at the end of September. They were also down 3.9 percent year-over-year.
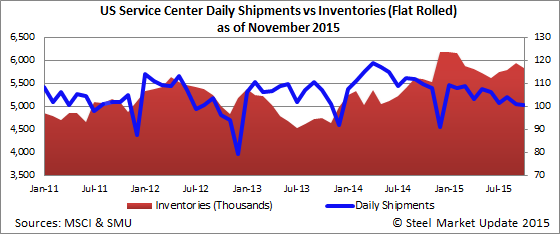
Carbon Flat Rolled
Total flat rolled shipments for the month of October were 2,212,600 tons up 4.4 percent, or about 100,000 tons more than the 2,119,300 tons shipped during the month of September. Shipments on a year-over-year basis were 12.2 percent lower than last year.
The 100,572 tons per day daily shipment rate was slightly lower than the 100,919 tons per day shipped during the month of September (September had 21 shipping days to October’s 22 days).
According to the MSCI carbon flat rolled inventories totaled 5,830,700 tons down 1.7 percent compared to the 5,928,900 tons reported for the month of September. Carbon flat rolled inventories are up 4.2 percent year-over-year.
The days of inventory on hand stood at 2.6 months (unadjusted) at the end of October which is an improvement over the 2.8 months reported at the end of September. One year ago the service centers ended the month of October 2014 with 2.2 months of inventories on hand.
The historical average for flat rolled inventories at the domestic (US) service centers is 2.3 months on hand at the end of October.
Carbon Plate: Inventories at Lowest Level Since May 2014
Shipments of plate totaled 326,800 tons for the month of October down 1.9 percent month-over-month and 21.3 percent lower on a year-over-year basis. The daily shipment rate was 14,854 tons per day vs. 15,866 tons per day during the month of September.
Plate inventories broke below 1 million tons for the first time since May 2014. October inventories were reported to be 931,000 tons, down 7.9 percent M/M and 25.1 percent Y/Y.
The number of months of plate inventories on hand dropped from 3.0 months in September to 2.8 months at the end of October. This is below the historical average (since 1987) of 3.1 months.
Carbon Pipe & Tube
Distributor shipments of pipe & tube were reported to be 221,100 tons during the month of October. Shipments rose 1.8 percent compared to September levels but were down 14 percent year-over-year. The daily shipment rate was 10,050 tons per day which is less than the 10,388 tons per day shipped during the 21 days of September.
Inventories of pipe & tube at U.S. service centers stood at 645,300 tons at the end of October down 4.5 percent M/M and down 5.6 percent Y/Y.
The number of months of inventories on hand stood at 2.9 months at the end of October vs. 3.1 months as of the end of September. The historical average (since 1987) has been 2.8 months.