

Analysis

November 19, 2015
Housing Starts, Permits and Builder Confidence
Written by Peter Wright
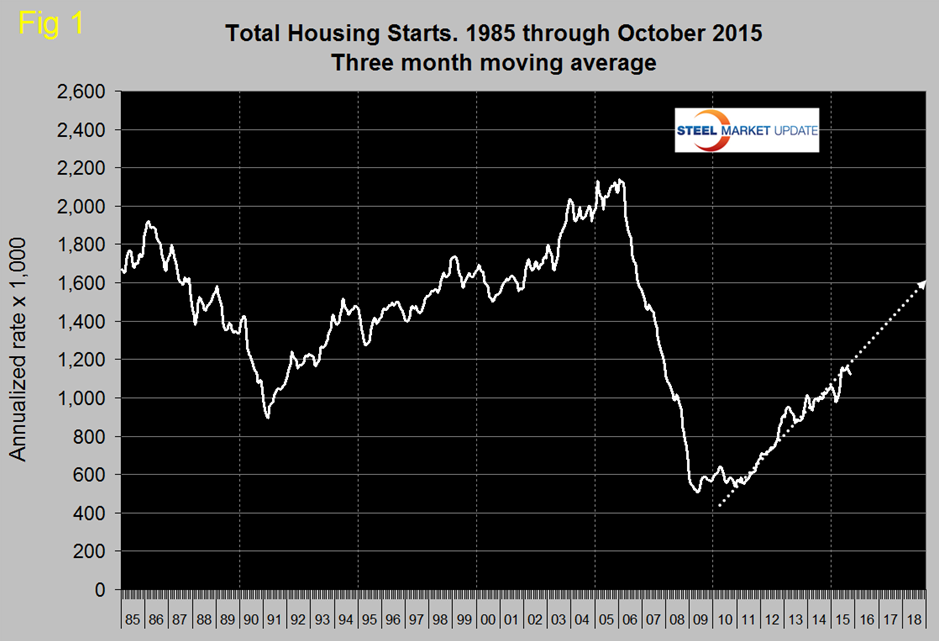
Total housing starts in October were at an annual rate of 1,060,000 which was the lowest number since March. In October the three month moving average (3MMA) was 1,122,000 which was down from 1,153,000 in September and from 1,160,000 in August.
August had the highest 3MMA since the recession so the sky is not falling. Total starts are still on track to reach 1.6 million units annualized by the end of 2018 (Figure 1).
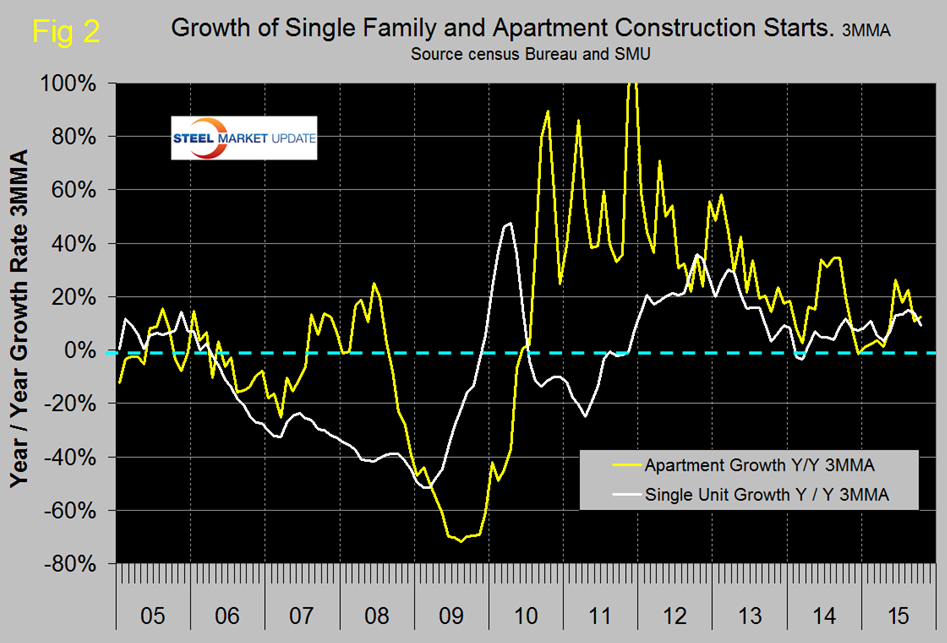
Single family starts in October were at an annual rate of 722,000 with a 3MMA of 732,000. The 3MMA was up by 9.3 percent year over year but is still 60.4 percent below the peak of late 2005. Multifamily (apartments/condominiums) starts in October were at an annual rate of 338,000 with a 3MMA of 390,000. The 3MMA was previously driven strongly by a freak result in June of 524,000 and as we expected dropped significantly in September and October (Figure 2).
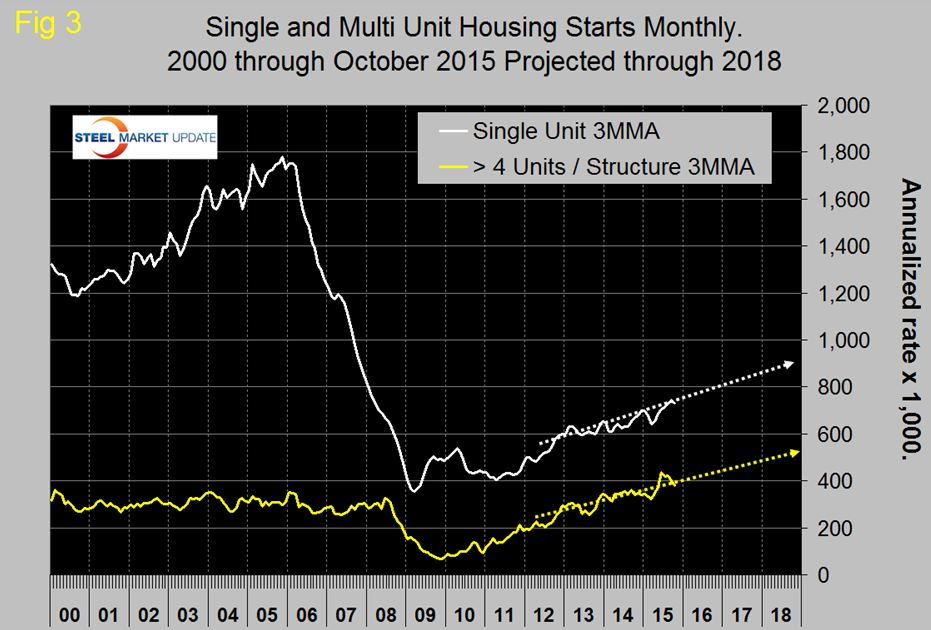
The Census Department results are seasonally adjusted and the monthly numbers are annualized. Multifamily starts had lack-luster growth for seven months prior to June and after a three month surge are now back to what is probably a more sustainable level. The trajectory of single family and apartments > 4 units are tracking to reach 900,000 and 500,000 by the end of 2018 respectively (Figure 3).
Permit data is considered to be a leading indicator for starts. If permits exceed starts then there should be an acceleration in construction and vice versa. Total permits in October were at an annual rate of 1,150,000 with a 3MMA of 1,139,000. Permits are back on track with starts after a major divergence in June (Figure 4), however it looks as though permits don’t always lead to ground breaking and sometimes, as in 2013 there can be quite a wide divergence.
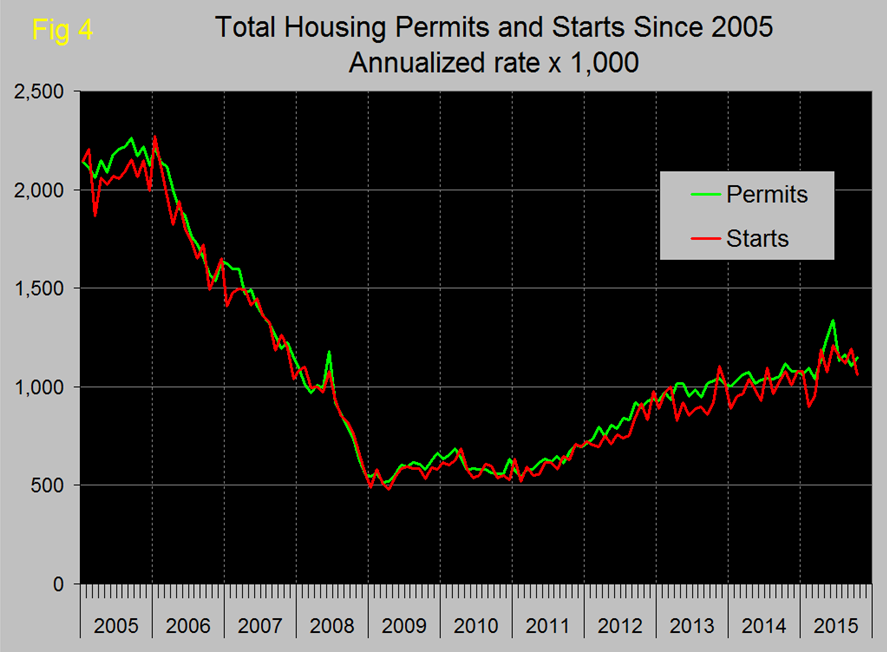
It also looks from Figure 4 that permits don’t really lead starts suggesting that the two are very close together from a timing point of view. On a 3MMA basis total permits were up by 6.3 percent y/y. Single family were up by 8.0 percent and multifamily by 3.7 percent. Multifamily permit growth peaked at 41.4 percent y/y in July. Most economists have been expecting a decline driven by the end of a tax subsidy in New York State and this can be seen in the data, where permits in the North East fell from 288,000 in May to 125,000 in October.
Table 1 shows total permits and starts nationally and regionally.
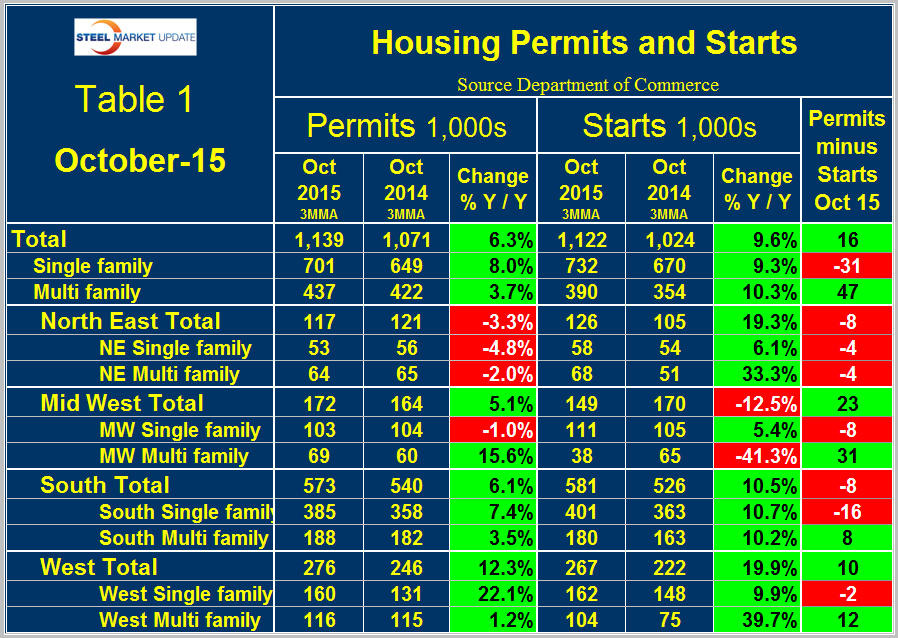
At the national level the differential between permits and starts for single and multi-family units is suggesting that the shift in consumer’s preference towards apartments is ongoing. In October on a 3MMA basis, permits of multi-family exceeded starts by 47,000 in contrast to the negative 31,000 for single family. In total permits were 16,000 more than starts. In the recent past the differential between permits and starts for multi and single family units has been the same across all regions but this is no longer the case. In the NE permits declined for both single and multi-family and were less than starts for both. Permits and starts for both categories had positive growth in the South and West. In all regions permits for single family were less than starts. The implication is that the shift in preference for apartments is by no means over and that single family construction will slow slightly. The ratio of the two sectors is shown in Figure 5 and demonstrates that single family homes continue to be less desirable than at any time since 1985.
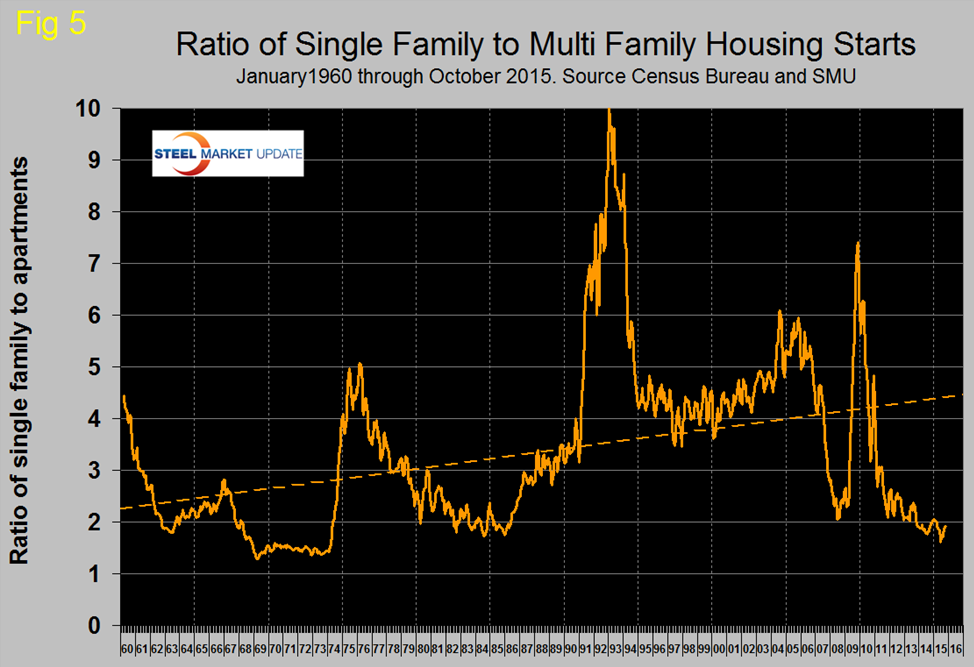
Figure 6 shows the regional situation for the 3MMA of total residential starts since February 2000.
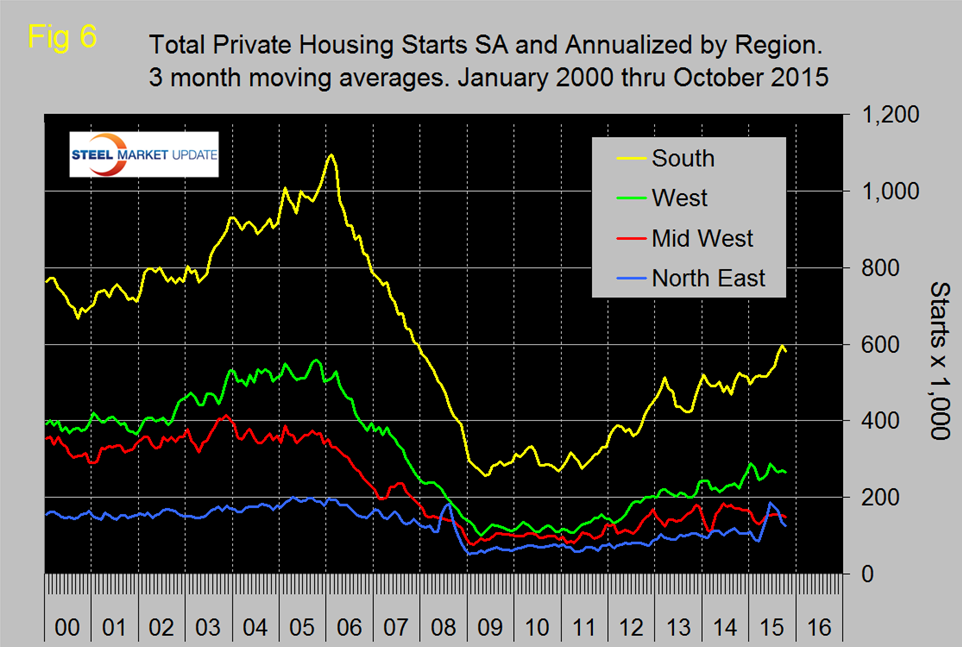
In the first half of 2015 the North East had the highest growth rate driven as mentioned above by apartment construction in New York state but now that has cooled. The South is growing the fastest at present.
The National Association of Home Builders (NAHB) confidence report was released on Monday. Any value above 50 indicates an overall positive business confidence. The national average dropped three point to 62, giving back last month’s gain. October had the highest confidence level since our data stream began in January 2009 and on a 3MMA basis, November has the highest reading (Figure 7).
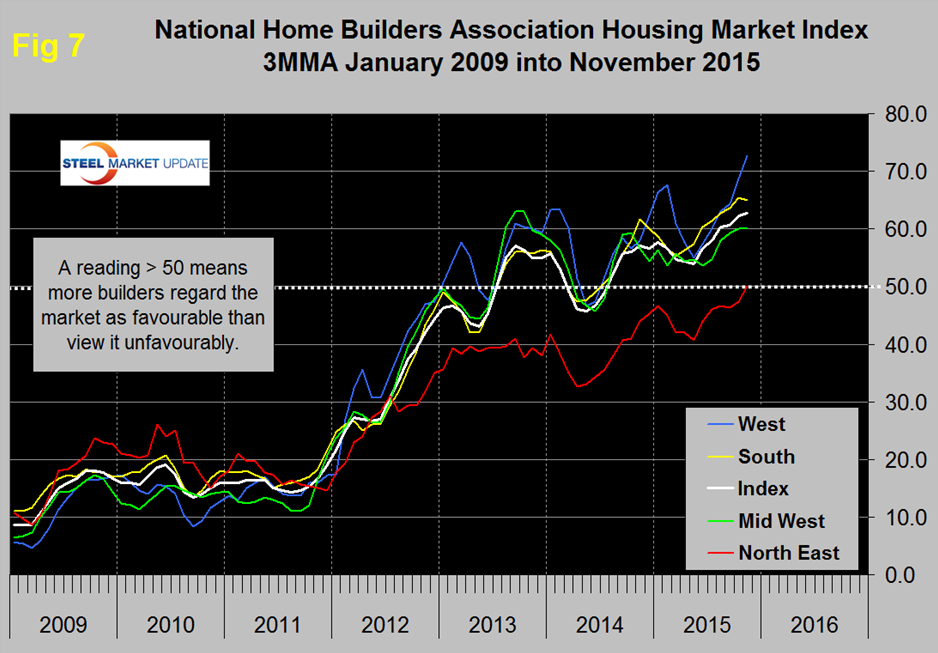
The South and West continue to be the strongest regions and the NE has finally reached 50.
The official release from the NAHB was as follows:
Builder Confidence Drops Three Points in November
Builder confidence in the market for newly constructed single-family homes slipped three points to 62 in November from an upwardly revised October reading on the National Association of Home Builders/Wells Fargo Housing Market Index (HMI).
“Even with this month’s drop, builder confidence has remained in the 60s for six straight months — a sign that the single-family housing market is making long-term headway,” said NAHB Chairman Tom Woods, a home builder from Blue Springs, Mo. “However, our members continue to voice concerns about the availability of lots and labor.”
“The November report is pullback from an unusually high October, and is more in line with the consistent, modest growth that we have seen throughout the year,” said NAHB Chief Economist David Crowe. “A firming economy, continued job creation and affordable mortgage rates should keep housing on an upward trajectory as we approach 2016.”
Derived from a monthly survey that NAHB has been conducting for 30 years, the NAHB/Wells Fargo Housing Market Index gauges builder perceptions of current single-family home sales and sales expectations for the next six months as “good,” “fair” or “poor.” The survey also asks builders to rate traffic of prospective buyers as “high to very high,” “average” or “low to very low.” Scores for each component are then used to calculate a seasonally adjusted index where any number over 50 indicates that more builders view conditions as good than poor.
Two of the three HMI components posted losses in November. The index measuring sales expectations in the next six months fell five points to 70, and the component gauging current sales conditions decreased three points to 67. Meanwhile, the index charting buyer traffic rose one point to 48.
Looking at the three-month moving averages for regional HMI scores, the West increased four points to 73 while the Northeast rose three points to 50. Meanwhile the Midwest and South held steady at 60 and 65, respectively.
Editor’s Note: The NAHB/Wells Fargo Housing Market Index is strictly the product of NAHB Economics, and is not seen or influenced by any outside party prior to being released to the public.
SMU Comment: Housing starts were one of the most prescient indicators of impending recession in 2007. Actually the most predictive of any indicator that we track. At the present time the housing market recovery as measured by total starts is still showing healthy growth. On October 22nd we got updated Federal Finance Housing Agency (FHFA) Housing Price Index and existing home sales figures, both of which pointed to an increasingly strong real estate market. The FHFA Housing Price Index said home prices were up 0.3 percent for the month, and up 5.5 percent compared to August-2014’s numbers. And, existing home sales were cranked up to an annual pace of 5.5 million houses… the second highest pace since 2007 (when the number was falling).
On October 30th Dodge published their forecast for 2016 which included the following comments on housing:
• Single family housing will rise 20 percent in dollars, corresponding to a 17 percent increase in units to 805,000 (Dodge basis). Access to home mortgage loans is improving, and some of the caution exercised by potential homebuyers will ease with continued employment growth.
• Multifamily housing will increase 7 percent in dollars and 5 percent in units to 480,000, slower than the gains in 2015 but still growth. Low vacancies, rising rents, and the demand for apartments from millennials will encourage more development.


