Analysis

November 23, 2015
US Vehicle Sales and NAFTA Vehicle Production in October 2015
Written by Peter Wright
In October, vehicle sales had another small gain from September’s post-recession high of almost 18.2 million units at a seasonally adjusted annual rate. This followed the August rate of 17.8 million units. Both at the time were the best pace since July 2005, when incentives caused sales to surge. Sales in October were 10 percent higher than the same month a year ago. Light trucks continued to dominate with 10.2 million units but declined by 100,000 in October. The balance, 8.0 million being autos which increased by 100,000. Crossover vehicles are classified as light trucks.
![]() So far this year, the sales pace average is 17.3 million units and it is probable that 2015 will have the best pace since 2001. Pent-up demand for vehicles is being quickly absorbed and the decline in gasoline prices is encouraging consumers to buy larger vehicles. North American assembled vehicles had a market share of 78.6 percent, down from >80 percent in September.
So far this year, the sales pace average is 17.3 million units and it is probable that 2015 will have the best pace since 2001. Pent-up demand for vehicles is being quickly absorbed and the decline in gasoline prices is encouraging consumers to buy larger vehicles. North American assembled vehicles had a market share of 78.6 percent, down from >80 percent in September.
Total light vehicle (LV) production in NAFTA in October was at an annual rate of 19.5 million units, production in the first ten months of this year has averaged 17.6 million units. In cases where seasonality is more than a weather effect we like to compare the monthly result with the monthly norm over a number of years. On average since 2004, October’s production has been 7.5 percent more than September. This year October was 6.8 percent higher than September. (Figure 1).
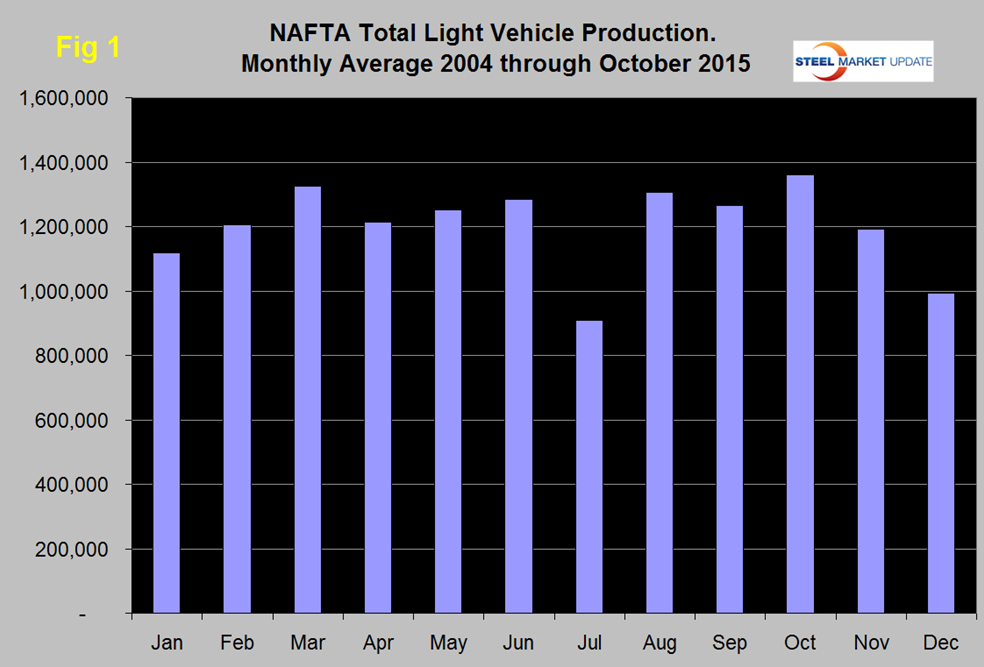
Note that production numbers are not seasonally adjusted but the sales data reported above are seasonally adjusted. October production was the highest of the year which has been the case for seven of the last nine years and was the highest month since May 2000. History tells us that assemblies will decline in both November and December then recover in January through March.
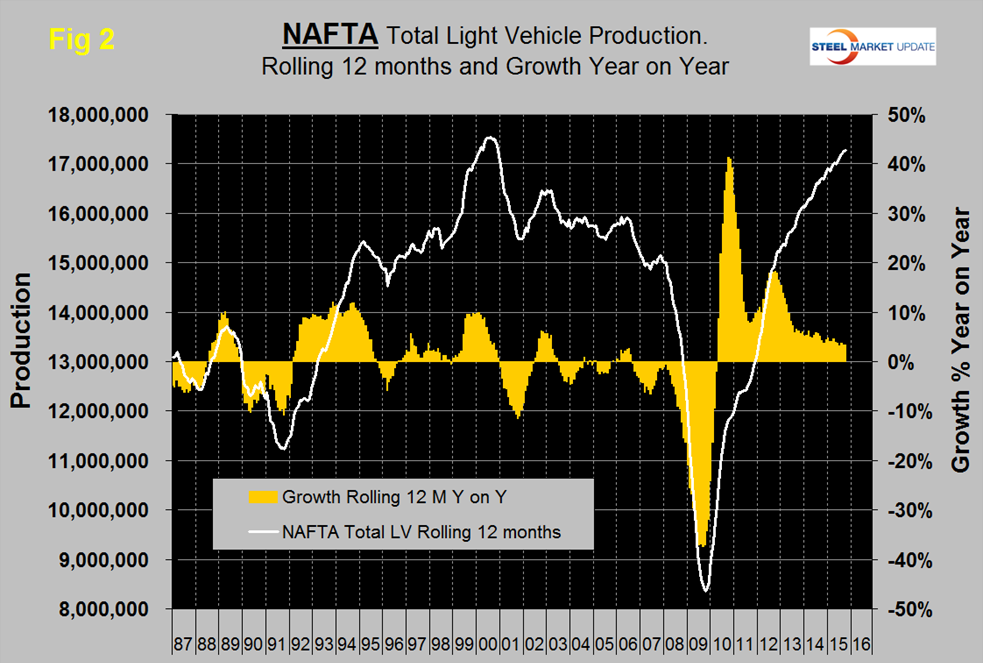
On a rolling 12 months basis y/y through October, LV production in NAFTA increased by 3.4 percent which was the same as last month, the growth rate has been slowing since the 4th Q of 2012. LV production in NAFTA is now well above the pre-recession peak of Q2 2006 and is heading for the all-time high of mid-2000 (Figure 2).
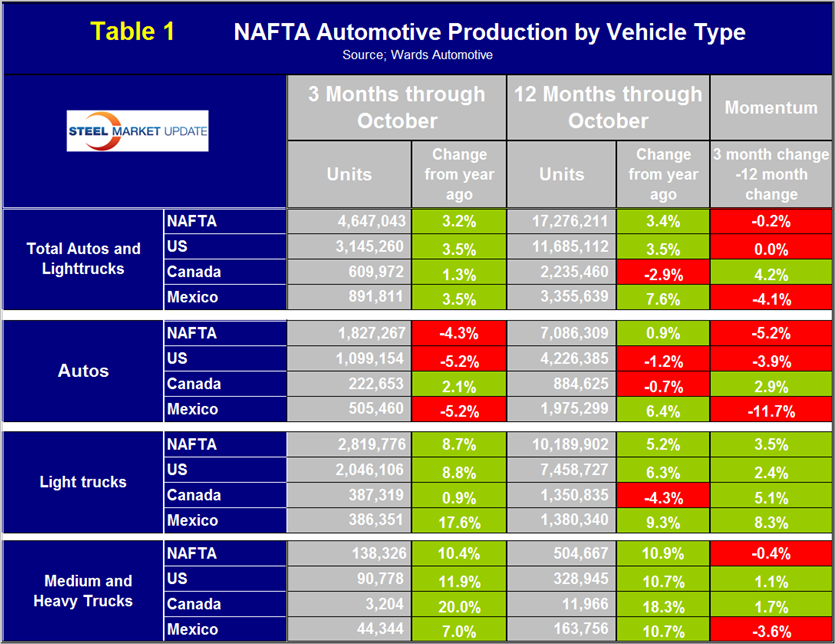
On a rolling 12 months basis y/y the US is up by 3.5 percent, Canada is down by 2.9 percent and Mexico is up by 7.6 percent (Table 1).
Growth rates in 3 months through October y/y indicate that Canada has positive momentum but that of Mexico is negative with the US even. Mexico has had negative momentum for six straight months and in seven of the last eight months. Having said that, when looking at the long term picture as we discuss below it is evident that the rising tide is lifting both the US and Mexico but Canada is languishing. The US has gained production share in the most recent 3.5 years (Figure 3) at the expense of Canada.
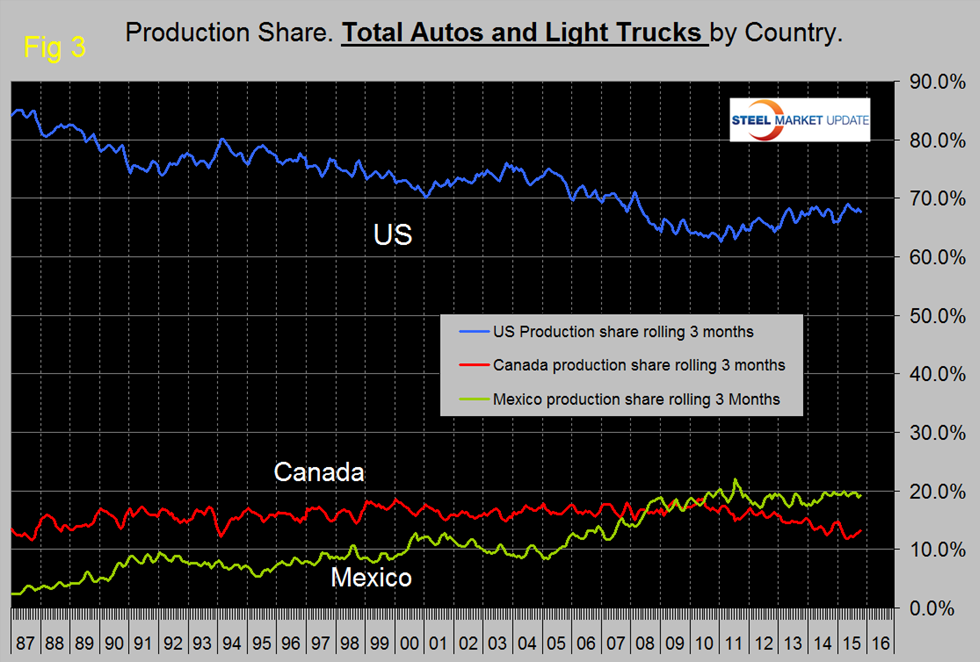
Mexico’s share has been fairly flat. A close examination of Canadian and US share this year in Figure 3 shows that there is a mirror image effect suggesting that the auto companies routinely move production from one side of the border to the other. In October on a rolling three month basis, the US production share of total light vehicles was 67.7 percent, Canada’s was 13.1 percent and Mexico’s was 19.2 percent.
Figure 4, Figure 5 and Figure 6 show total LV production by country with y/y growth rates and on each the red line shows the change in production since Q2 2006.
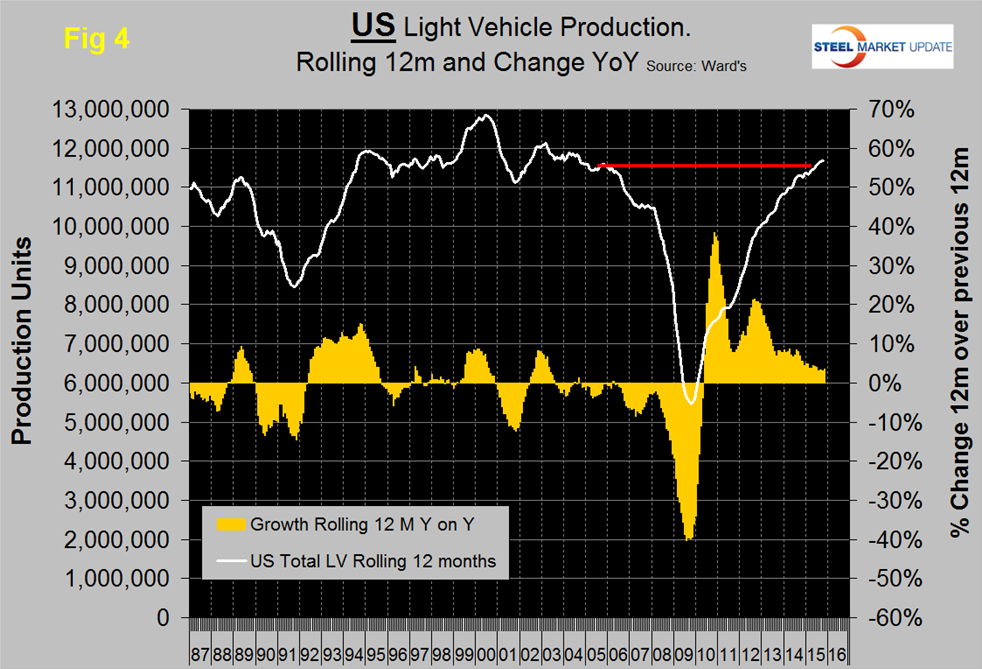

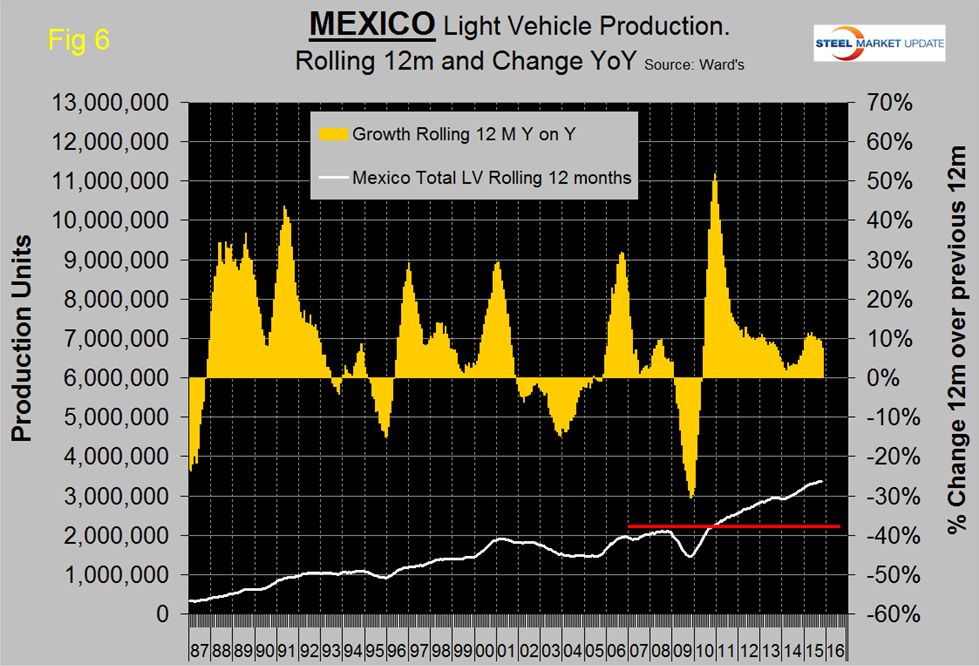
Note the scales are the same to give true comparability and that Mexican growth is surging at more than twice the rate in the US. Canada continues to contract. In the course of 2015 growth has slowed in both the US and Mexico, contraction in Canada has been ongoing for over two years. During the recession Mexico declined by less than the US and bounced back by more during the recovery. This caused Mexico’s production share to surge until Mid-2011 at the expense of the US.
The percentage of Autos in the production mix of all three countries is down this year, meaning that light trucks are up. The mix of light vehicles is very different by country (Figure 7).
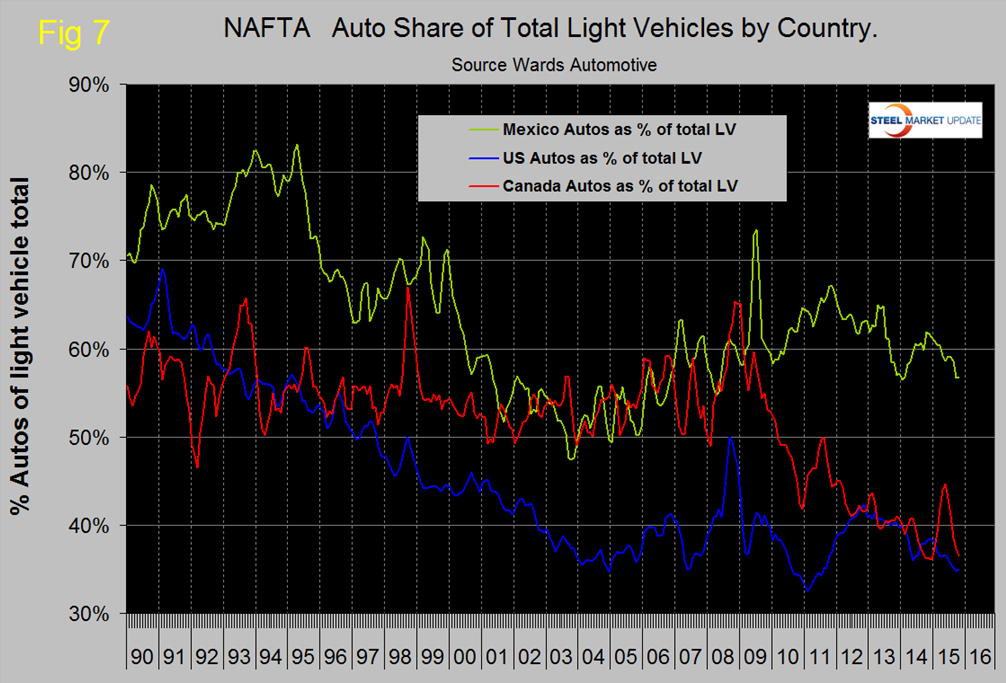
The percentage of autos in the Mexican mix in the last three months was 56.7 percent but only 34.9 in the US and 36.5 percent in Canada. September and October had the lowest percent of autos in the US mix since July 2011 as buyers preference tilts towards light trucks driven by declining gas prices.
Ward’s Automotive reported this week that total light vehicle inventories in the US increased by 9 days of sales from 60 at the end of September to 69 at the end of October but down by 6 from October last year. Month over month FCA (Fiat Chrysler Automotive) was up by 13 days to 90, Ford was up by 14 days to 81 and GM up by 8 days to 75.
The SMU data file contains more detail than be shown here in this condensed report. Readers can obtain copies of additional time based performance results on request if they wish to dig deeper. Available are graphs of auto, light truck and medium and heavy truck production and growth rate and production share by country.